
By Ryan Brennan
Naked put-selling is a very popular and potentially profitable trading strategy, but choosing what puts to sell can sometimes be a guessing game. McMillan's Probability Calculator Software is a very helpful tool for analyzing potential put-sales since it can estimate the chances of making money in your positions. The idea is that by adhering to a few simple guidelines and consistently establishing positions that have a high probability of being profitable, you can increase the odds of profitability in your actual trading.
Here are 3 rules to follow when establishing naked put-sales:
- Only sell out-of-the-money puts
- Only establish put-sales that have an 80% chance or better of making money
- Stop yourself out of the trade (buy back your put) if the stock closes below your downside break-even point
To determine our chances of making money in a put-sale we'd enter values in to the Probability Calculator and analyze the results. Let's use the Caterpillar (CAT) November 75 Put-Sale mentioned in last night's Daily Strategist as an example. Consider the following inputs:
Ticker: CAT
Stock Price: 85.47
November 75 Put: 0.72
100 Day Historical Volatility: 29*
*Historical Volatility data is available on the Free Weekly Volatility Data section on our site. Daily volatility data is available on the Strategy Zone.

First, we'd enter the stock price. The Upside Price would be irrelevant in this study, but for the sake of this example, we'll enter a value of 90.
Next, we'd enter the downside price. When analyzing naked put-sales, we'd want to enter our position's downside break-even price. This can be determined by subtracting the put premium initially received (0.72) from strike price of the put being sold (75). This would make our downside break-even point 74.28.
Since we are selling November options, we would select the November expiration date of 11/16/12 from the calendar. The standard expiration date for options is the third Friday of each month.
The Probability Calculator is only as good as the inputs we supply, and the volatility reading is the most important of these inputs. Entering too low of a volatility can make your probability seem better than it is, so we always suggest overestimating the reading when you're not sure which volatility to use. For more information on volatility, you may want to watch Stan's recent The Various Volatilities webinar. When selling puts, we suggest using a historical volatility like the 100-day volatility. In this case, the volatility reading would be 29.
The "expected stock return" or "drift" is not important for short term studies, so we would just set it to 0. In a longer term study, we'd enter the current risk-free interest rate.
After inputting all of your data, we'll click "calculate" and our results are generated and displayed.
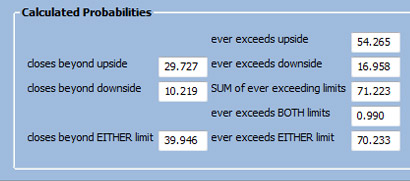
The results we are most concerned with are the "closes beyond downside" and "ever exceeds downside" outputs. In our CAT example, the calculator displays that there is roughly a 10% chance of the stock closing beyond the downside limit and a 16.96% chance of it ever exceeding that limit before expiration. Since we'd be stopping ourselves out of our position if the stock were below our downside break-even point, we'll pay most attention to the "ever exceeds downside" reading (the closes beyond downside reading displays the probability that the underlying security will be below the downside price at the end of the trading period). According to the calculator, there is approximately an 83% chance of the position making money, which would make this a viable put-selling candidate based on the guidelines we set. If the results predicted a greater than 20% chance of closing beyond the downside limit, we would stay away from the trade and look for a different put to sell. Deciding which put to sell when comparing multiple viable trading candidates is an easy decision since all you have to do is select the put-write that has the highest probability of making money.
If you're looking for put-selling ideas, The Strategy Zone offers a daily list of potential naked-sales ranked by both "probability of not touching the downside break-even point" and "annualized expected return." Our Daily Strategist Newsletter narrows down that list to a handful of candidates and offers actual put-selling recommendations.
© 2023 The Option Strategist | McMillan Analysis Corporation