Jul, 02, 2026
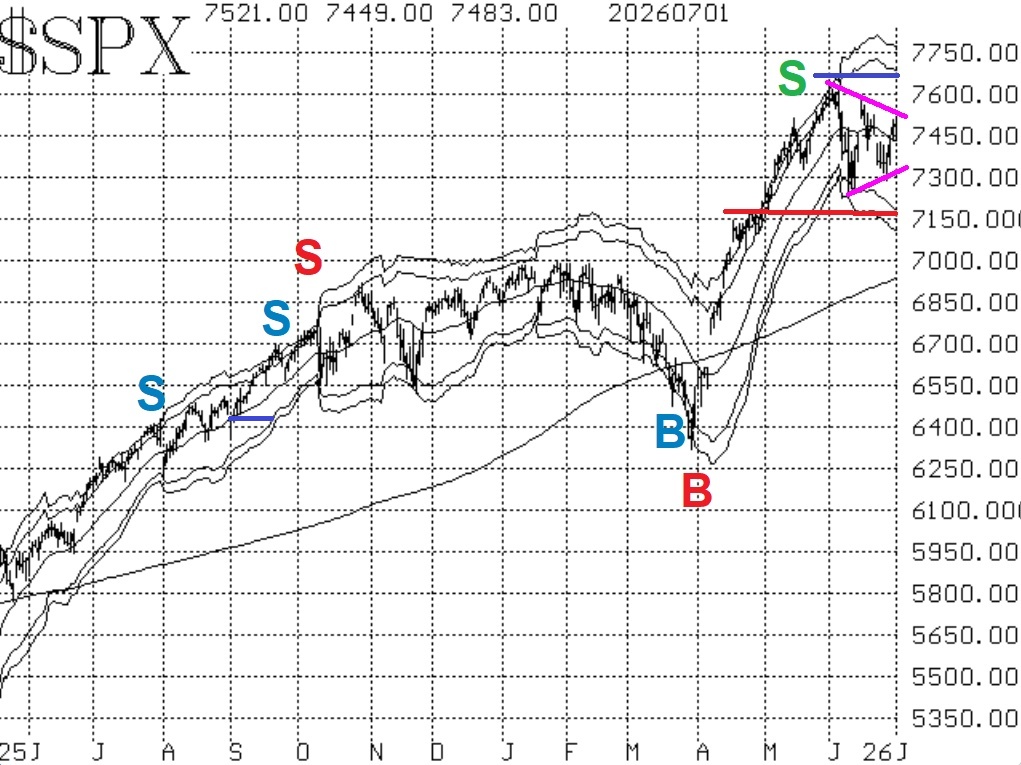
By Lawrence G. McMillanThe market continues to consolidate in the triangle formation that we had pointed out previously. It is currently trying to break out on the upside. The pink lines on the chart...

Jun, 29, 2026
By Lawrence G. McMillanJoin Larry McMillan as he discusses the current state of the stock market on June 29, 2026.
Jun, 26, 2026
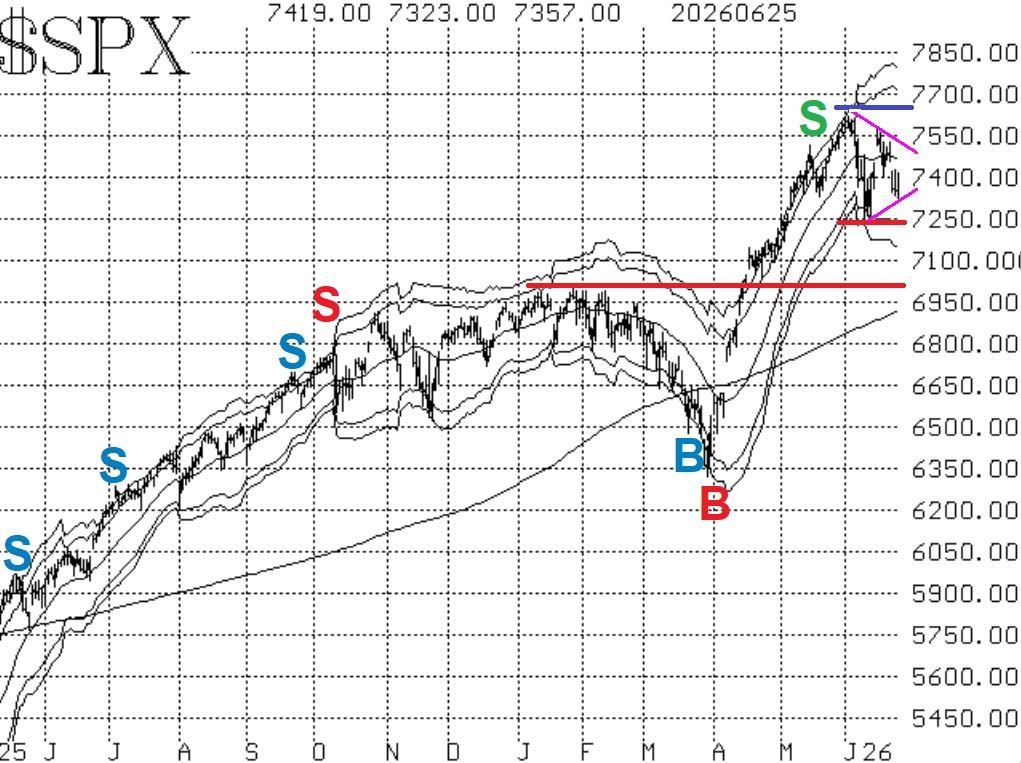
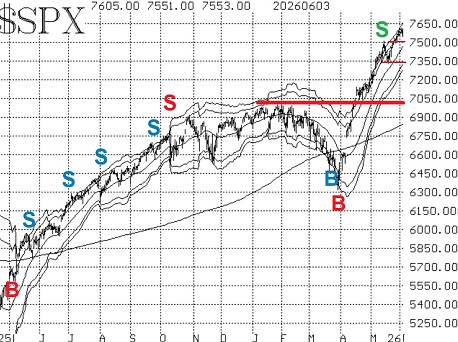
By Lawrence G. McMillanThere has been a considerable amount of intraday volatility, but $SPX has not changed much in net closing price. There is major resistance at the all-time highs, 7600-7620....
Jun, 23, 2026
By Lawrence G. McMillanJoin Larry McMillan as he discusses the current state of the stock market on June 22, 2026.
Jun, 18, 2026
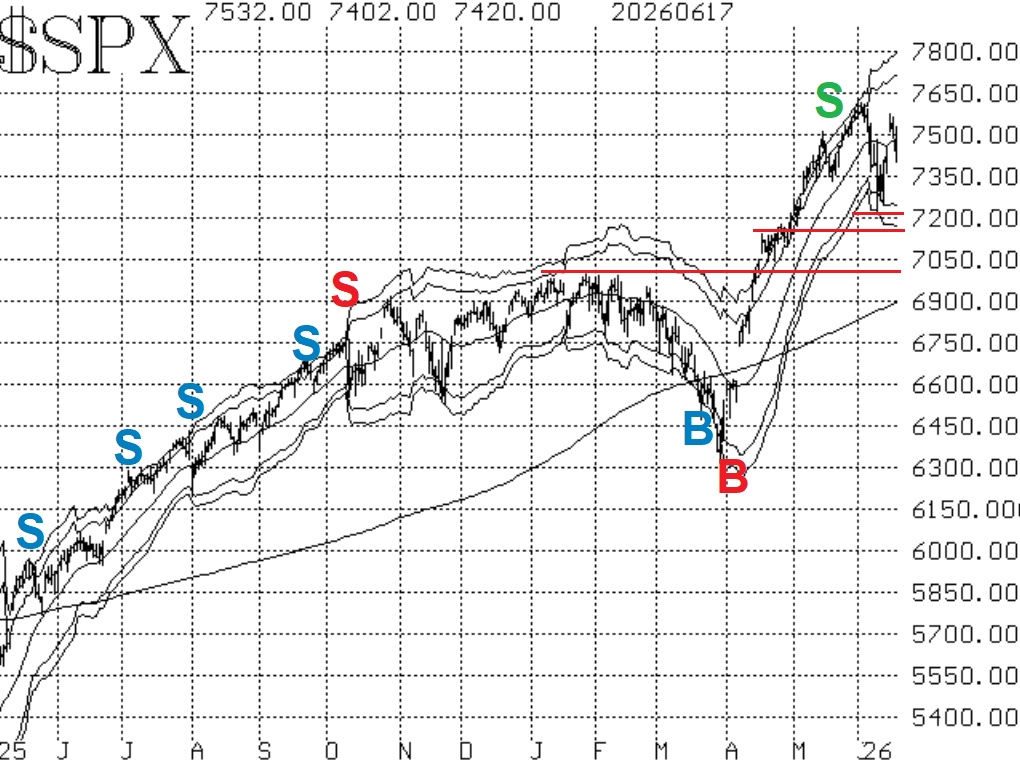
By Lawrence G. McMillanThe market bounced back from its brief correction in early June, but $SPX has not yet recovered to new all-time highs. As a result, the $SPX chart itself is in a neutral state...
Jun, 15, 2026
By Lawrence G. McMillanJoin Larry McMillan as he discusses the current state of the stock market on June 15, 2026.
Jun, 12, 2026
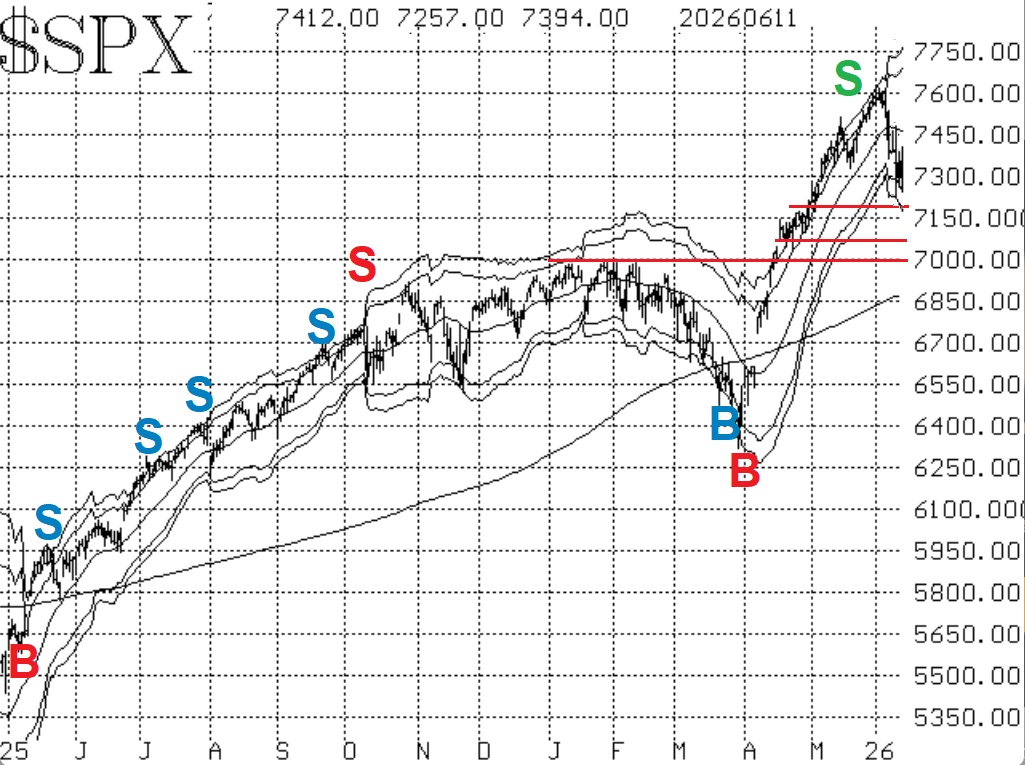
By Lawrence G. McMillanIn all, the correction from the early June highs to the lows of this week was about 5%. That was enough to at least temporarily remove the "bullish" designation from the $SPX...
Jun, 08, 2026
By Lawrence G. McMillanJoin Larry McMillan as he discusses the current state of the stock market on June 8, 2026.
Jun, 05, 2026
By Lawrence G. McMillanThe S&P 500 Index ($SPX) has advanced on ten of the last eleven trading days. Needless to say, the Index chart has strong upward momentum. Media articles continue to focus...
Jun, 01, 2026
By Lawrence G. McMillanJoin Larry McMillan as he discusses the current state of the stock market on June 1, 2026.
Pages
© 2023 The Option Strategist | McMillan Analysis Corporation