By Lawrence G. McMillan
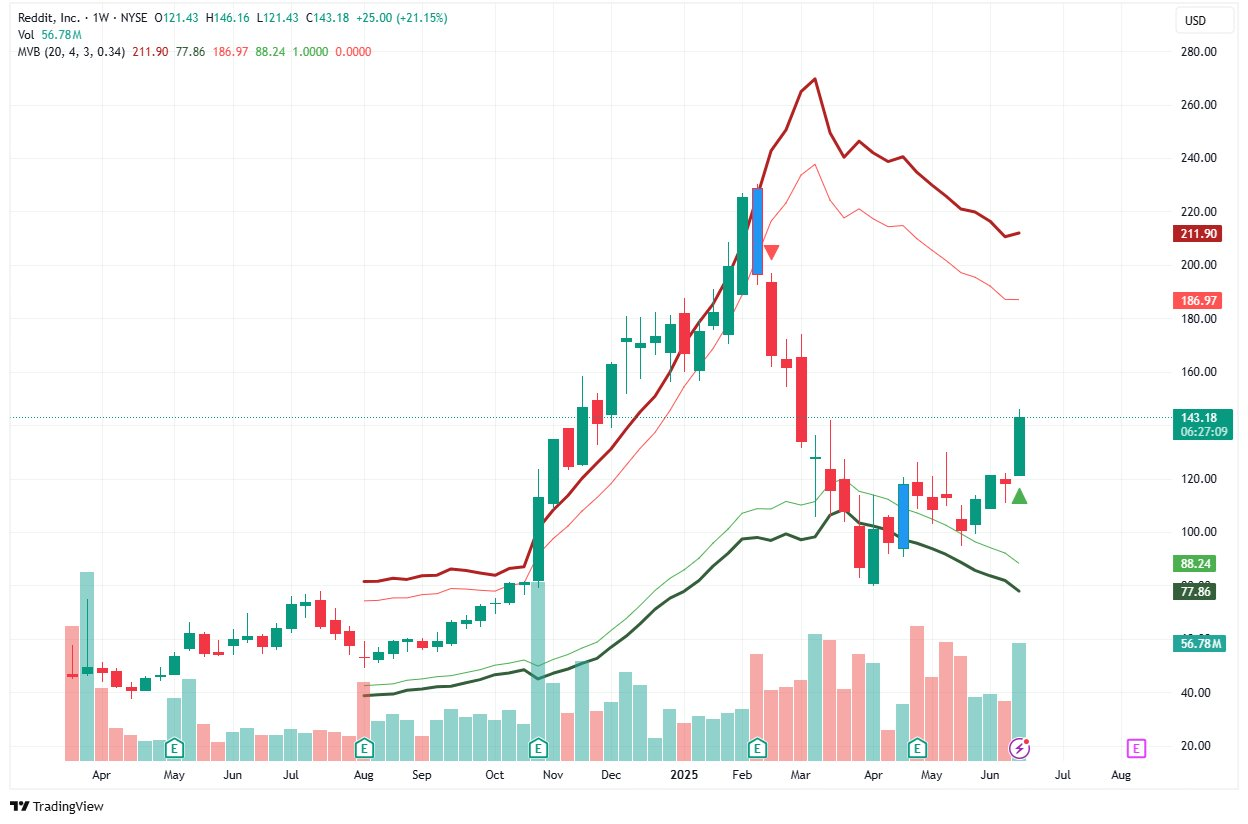
$RDDT issued its first weekly McMillan Volatility Band (MVB) Buy signal (chart above) this week since being listed—an encouraging development for bullish traders watching the stock's momentum.
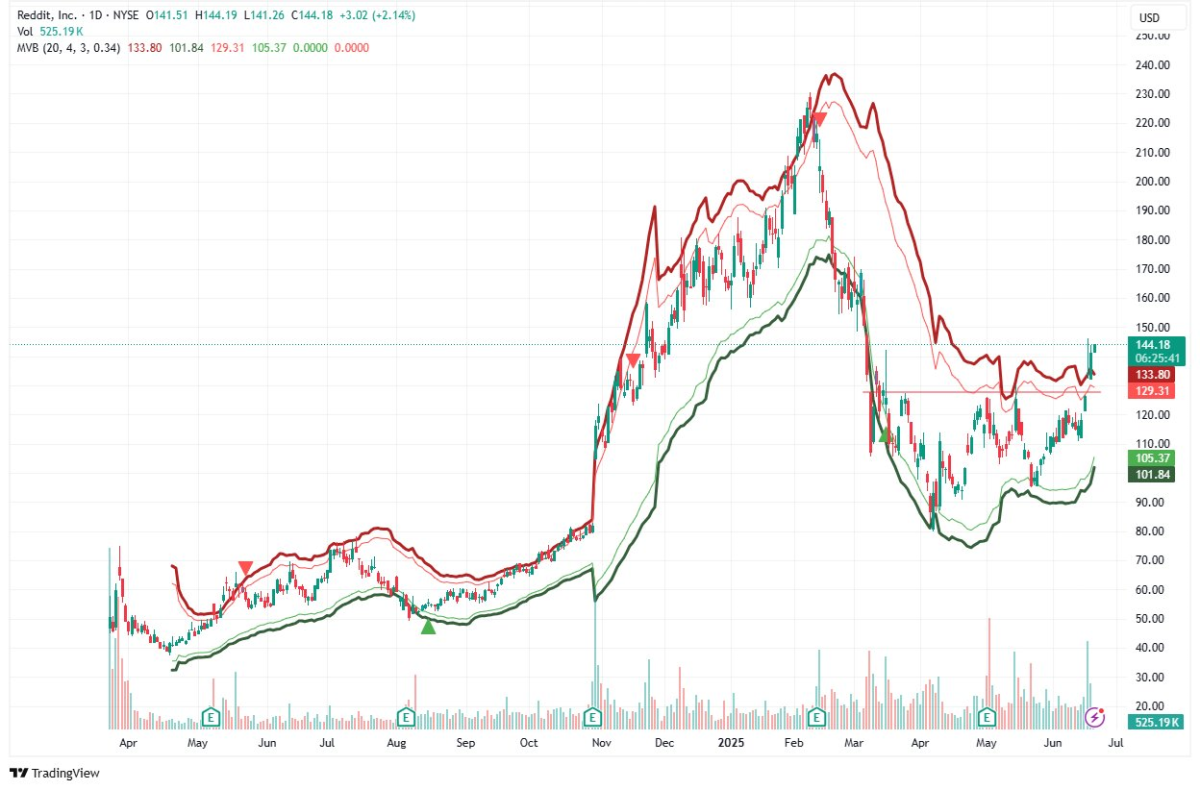
On the daily chart (below), $RDDT broke out above the key resistance area near 130, successfully retested that breakout level, and has since resumed its move higher. This kind of confirmation—weekly and daily alignment—is what makes the MVB indicator so valuable.
Want to see these signals in real time?
The McMillan Volatility Bands indicator is available for daily and weekly charts, giving you timely, rule-based entries and exits. Don't trade blind—get the edge with MVB.
© 2023 The Option Strategist | McMillan Analysis Corporation