
By Lawrence G. McMillan
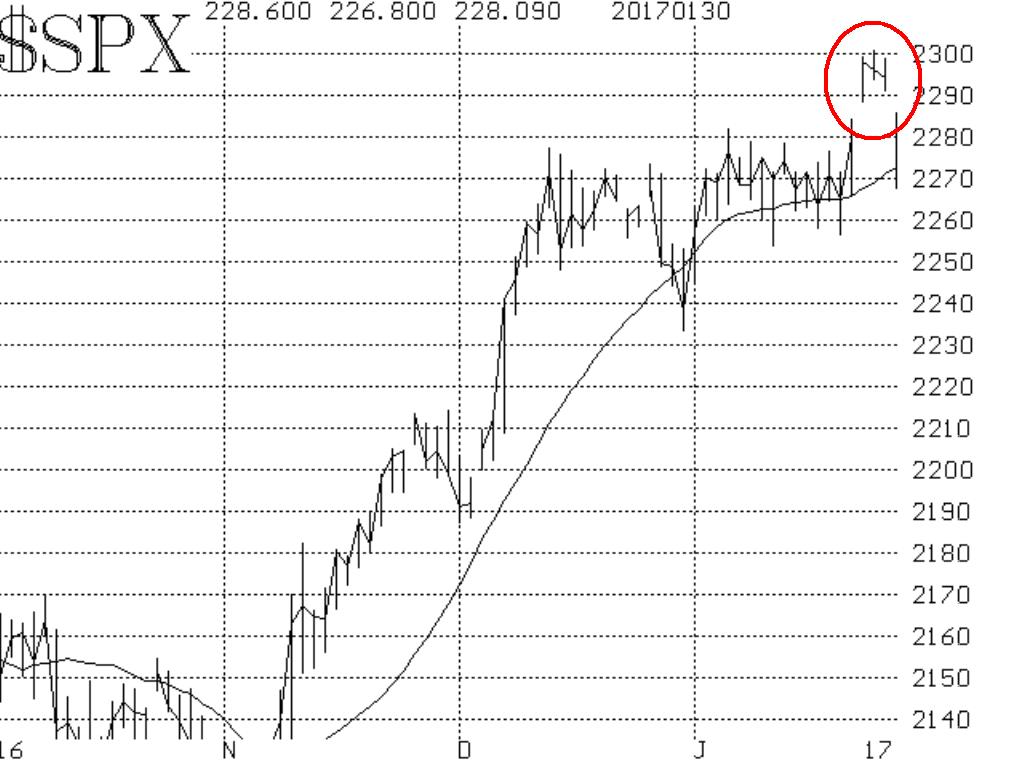
Yesterday was not a good day for stocks, but considering how far the rally has come in the last few months, it wasn’t too surprising to see a setback of sorts. However, the selling generated some sell signals and it has left a warning sign on the $SPX chart – an island reversal. One does not often see islands on the averages because the electronic computation of the Index begins as soon as any stock in the index opens. If there is a gap on the $SPX chart, it essentially means that nearly all of the stocks are opening on gaps. In any case, an island reversal of this sort is a big negative. So now I would say the two levels to watch are: 1) a rise above 2290 (which would close the gap and negate the island reversal), or 2) a close below support at 2255, which would essentially say last week’s upside breakout was a false one. Right now, with $SPX in between those two levels, we are just going to watch, but things could be interesting...
This commentary was excerpted from this morning's edition of The Daily Strategist. Read the full article by subscribing now. Sign up for a free 7-day trial today.

© 2023 The Option Strategist | McMillan Analysis Corporation