
Craig Hilsenrath
For the Introduction an explanation of Expected Value, refer to Enhancing Option Portfolio Returns Using Probability and Statistics - Part 1.
Expected Value and Option Strategies
Recalling the definition of expected value, the weighted average value of a variable, we first need to determine which variable we want to model. Since the goal of placing a trade is to earn a profit we want to determine what the expected profit of the trade is before putting it on. If the expected profit is positive then, on average, we can expect to make a profit on this trade. If the expected profit is negative then we should NOT do the trade.
As a simple example consider an at-the-money long $50 strike call position with ninety days to expiration put on for a $2.50 debit. Since the value of an option is partially derived from the price of the underlying, the expected profit can be calculated by using the underlying price as the random variable. The role of volatility, another important input into the calculation of the value of an option, will be discussed later. Table 1 shows how the expected profit at expiration can be calculated. The table shows nine possible values of the underlying stock at expiration, the probability that the stock will be at that price in ninety days, the value of the call at expiration at the underlying price and the profit/loss of the position. The final column shows the product of the profit and probability columns. At the bottom of the Probable Profit column is the weighted average sum for an expected profit of $1.85.
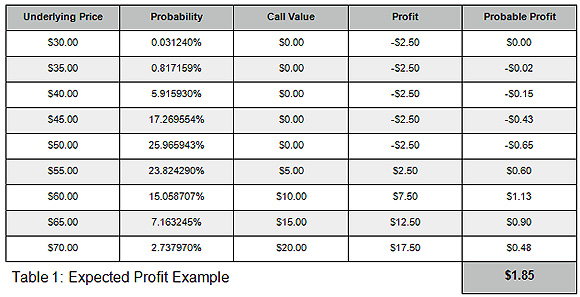
Analysis of the data in Table 1 reveals some important properties of the expected profit calculation. Two principal differences between the gaming examples above are evident. First, in practical terms, “all the possible values” of the variable cannot be known. Since the price of the stock can take on any value between zero and infinity, a range of prices will need to be selected that will give the trader enough confidence in the resulting expected profit. In statistics this range is called a confidence interval.
In any trading endeavor a prediction about the future value of some variable must be made. An option trader is typically attempting to make a profit over a range of the underlying price. Predicting this range depends on an expectation of the volatility of the underlying price over time. Since volatility measures the standard deviation of price returns, standard deviations can be used to determine the range of prices for the desired confidence interval. Professional risk managers typically use an interval from -3.0 to +3.0 standard deviations because that range corresponds to a 99.7% confidence. From a statistical perspective this means that the underlying price should fall within that range for 99.7% of the observations. Equation 1 shows how to calculate what the underlying price is for a given number of standard deviations.
Equation 1
![]()
where:
P0 = The current price of the underlying.
e = The natural exponential constant.
σ = The volatility for the period.
n = The number of standard deviations.
Assuming an annualized volatility of 25% -- 14.94% for the 90-day period using the square root of time rule, σT = σ√(90/252) -- and a current price of $50 the price ranges from $31.94 to $78.28 for the 99.7% confidence interval.
The next question that arises is how to pick the prices in between the end points. Using Equation 1 Pn can be determined for any number of standard deviations. So the objective is to pick some increment of n that will result in enough prices to obtain an acceptable sampling but not so many as to make the calculation too time consuming. As it turns out this is closely related to how the probability of the underlying price moving to that level is determined.
Determining the probabilities is the second difference between the gaming examples and the expected profit calculation. Whereas the probabilities for the casino games are known and constant, the probabilities used to calculate expected profit are dependent upon an assumption about the price volatility of the underlying asset.
The Natural Exponential Function
In mathematics the natural exponential function, ex, is the natural exponential constant e (approximately 2.718281) raised to a power. The exponential function is used to model a relationship where a constant change in a variable results in an exponential change in another variable. The natural exponential is closely related to the natural logarithm, ln. In fact, ex and ln x are algebraic inverses.
In finance the exponential function is commonly used to calculate continuously compounded interest. The natural logarithm is used to model asset returns.
Tune in next time for Part 3 to see how to determine probabilities. For powerful option trading software that calculates expected return, subscribe to Option Workbench.
![]()
© 2023 The Option Strategist | McMillan Analysis Corporation