
Craig Hilsenrath
With nearly four thousand optionable U.S. equities and ETFs and over 400,000 individual option contracts available on a daily basis, retail option traders need a way to determine the optimal way to allocate their investment capital. By employing some well known statistical techniques to calculate the expected profit and return for a set of option positions, an option strategist can rank possible trades. These techniques can be used across diverse positions, assets and asset classes to compare positions and determine the optimal utilization of investment capital.
Introduction
One of the advantages of investing with options is that mathematical models can be used to compute a theoretical value for the options. The theoretical value can then be compared to market prices to determine whether trading opportunities exist. Using some of the statistical techniques that underly option pricing one can also construct measurements of option performance. One such measure is expected return. Expected return is a statistical measure of a position’s estimated return on investment.
In this blog post we will first examine the calculation of expected value. The expected value is used in many diverse industries and situations including manufacturing, medical research, gaming and finance; it is also the basis for the computation of expected return. The first section examines how expected value is calculated in general and provides examples of how casinos use expected value to make their profits.
As opposed to casino games where the probabilities are known and constant, those associated with an option position’s expected profit are based on a trader’s assumptions about future market conditions. The second section shows how to calculate the expected profit for an option position with an emphasis on how to compute the probabilities.
Simply using expected profit to compare positions is not sufficient to make an informed decision. A position with a high expected profit may entail a large amount of risk. Therefore, a position with a lower expected profit and lower risk may be more desirable. The final section examines how expected return is calculated and used to compare positions.
Expected Value
In plain language the expected value is the best estimate of a value at some time in the future. The estimate is calculated by computing the weighted average sum of a set of possible values. Ideally we’d like to use all possible values to calculate the expected value but that is not always possible. In general the weighted average is calculated by:
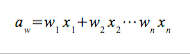
In a simple average the weight associated with each value is 1 divided by the total number of values, or n in the formula above. For the expected value calculation the weight for each value is the probability of that value occurring.
The probability associated with a particular value, xi, is found by taking the ratio of the number of times the xi can occur divided by the total number of observations. A simple example of this type of calculation is the roll of a single die. The probability of rolling any of the numbers on the die is 1 out of 6 or 16 2/3 percent.
To make this a little more interesting, suppose a game was constructed where the operator would roll a fair die and payout 3:1 on a bet to someone who picked the number that comes up on the die. If a person bets $25 the operator would give them back $100, their $25 bet plus $75. At first glance this might seem like a good way for the operator to lose $75. But applying the expected value calculation reveals a different story. The probability of the operator having to pay out $75 is 1/6 and the probability of them keeping the $25 is 5/6. So the expected value of this game is:
-75 x 1/6 + 25 x 5/6 = 8 1/3
So on average the operator would expect to make approximately $8.33 per $25 bet. It should be noted that the operator cannot make $8.33 on any single roll. This illustrates that the expected value need not be one of the possible outcomes.
To drive this point home consider the expected value of a roulette wheel from the perspective of the house. A roulette wheel has slots numbered 1 to 36, half of which are colored black and the other half red. There are two additional slots numbered 0 and 00 colored green for a total of 38 slots. There are two main types of bets that can be made at a roulette wheel. In the first type of bet the gambler picks a number from 1 to 36 and if that number comes up the gambler gets paid 35 times the amount bet. In the second type of bet the gambler picks a color, black or red, and if the color comes up the gambler receives a 2:1 payout. So if $1 is wagered on red and the ball lands in a red slot the bettor gets back $2. The expected value of these bets house are:
Bet 1: -35 x 1/38 + 1 x 37/38 = 0.0526
Bet 2: -1 x 18/38 + 1 x 20/38 = 0.0526
From the above, the casino expects to make 5.26 cents for every dollar bet at a roulette wheel. Conversely, a gambler should expect to lose 5.26 cents for every dollar be at a roulette wheel.
Using expected value does not guarantee that ANY roll of a die or spin of a roulette wheel will have a positive outcome for the game’s operator. It does indicate what the AVERAGE outcome will be over many such rolls and spins and gives the house an edge over time - essentially the expected profit for the house. Considering the billions of dollars in annual revenue generated by the gaming industry, expectations do not need to be very high if many games with positive expectation can be played. This is all very interesting for casino operators and traveling dice games, but how does it pertain to trading options?
Tune in next time for Part 2 to see how you can apply this to various options strategies. For powerful option trading software that calculates expected return, subscribe to Option Workbench.
![]()
© 2023 The Option Strategist | McMillan Analysis Corporation