By Lawrence G. McMillan
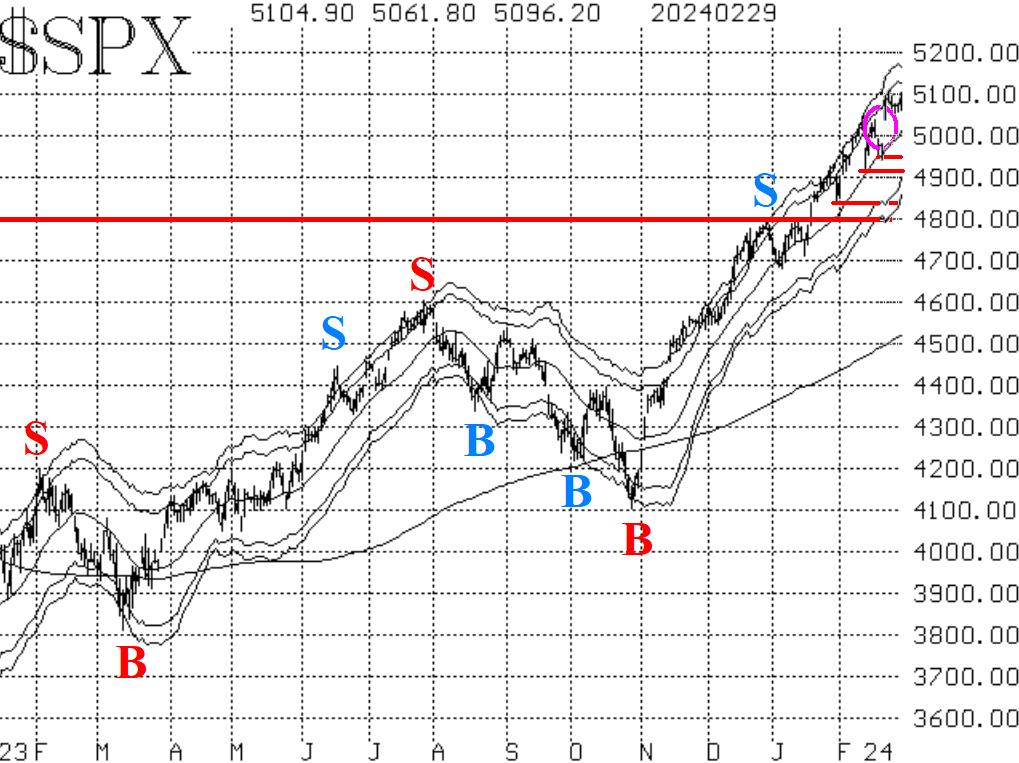
After gapping sharply higher on the NVDA earnings (February 22nd), $SPX slowed down a little but did not really pull back strongly. In fact, the Index made another new closing high yesterday. There is still a large gap on the chart (circled in Figure 1 on the upper right), from the post-NVDA reaction, and it would probably be a healthy thing if that gap were closed (a move down to 4983 would accomplish that).
There are several small support areas, mostly at the various one-day-selloff lows of the past few weeks. They are denoted by horizontal red lines on the $SPX chart in Figure 1. The major support area is at 4800, mainly because of the "work" that the Index did trading between 4680 and 4800 in December and January. A close below 4800 would likely be interpreted as very negative, for it would mean the entire breakout of 2024 would have been a false one, and it would also mean that the Index had slipped back below the 2022 highs. This seems improbable, but it is worth noting, just in case.
Equity-only put-call ratios continue to drift sideways at very low levels on their charts. They are in an overbought state, for sure. Moreover, the computer analysis programs continue to "say" that these charts are on sell signals. The computer programs are using a "mean reversion" process to determine that, but in real life, we would need to see these ratios rising before declaring a tradeable sell signal. Note how they rose in August of last year; that is what a "real" sell signal looks like. So, for now, these ratios are merely overbought and not on verifiable sell signals.
Breadth has struggled to stay positive, and those struggles have accomplished enough that the breadth oscillators remain on buy signals. They could easily roll over to sell signals with a couple of days of negative breadth, but that hasn't happened.
$VIX has returned to low, benign levels. That keeps the "spike peak" buy signal in place. In addition, both $VIX and its 20-day Moving Average are below the 200-day Moving Average, so the trend of $VIX is downward, and that is bullish as well.
So, we are maintaining a"core" bullish position, and we are prepared to trade other confirmed signals around that "core" position. There are no confirmed sell signals in place at the current time. Eventually some will appear, but we are not going to try to guess where the top might be. Our indicators will give us fair warning. Meanwhile, continue to roll profitable calls up to higher strikes when they become deeply in-the-money.
This Market Commentary is an abbreviated version of the commentary featured in The Option Strategist Newsletter.

© 2023 The Option Strategist | McMillan Analysis Corporation