By Lawrence G. McMillan
Every week there seems to be a small "saga" that affects the market briefly for only a day or two. Then, stocks roar back (at least some stocks do), carrying the major indices -- $SPX, $NDX, and $DJX -- to new all-time highs. At this point, the broad market doesn't really care that $RUT (IWM) is lagging behind even more than ever. New all-time highs are an elixir in their own right, and traders are shunning under-performing stocks and sectors to get into what is doing well. This generally works, at least for a while. There's an old adage that the Wall Street Journal publishes a list of the stocks with the most momentum every day: it's called the list of "New Highs."
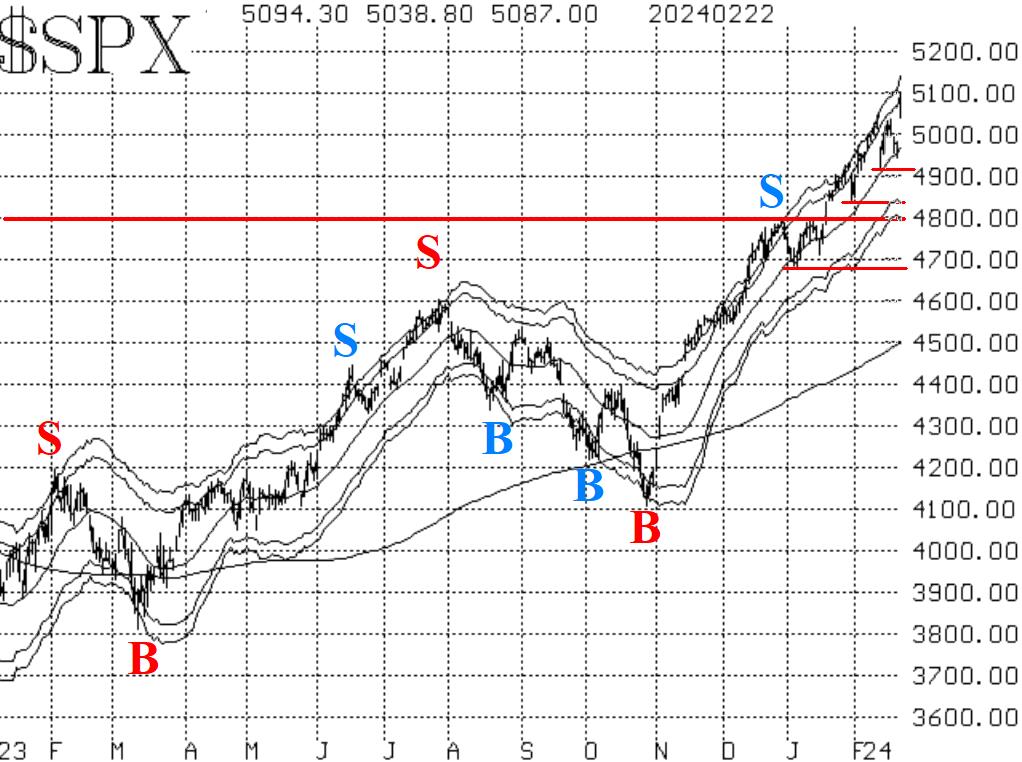
Since we use $SPX as our basic definition of "the market," we are maintaining our "core" bullish position, for the simple reason that the $SPX chart is positive. There is support at each recent "saga's" lows: 4920, 4840, and then the considerable support area of 4680 to 4800.
Both equity-only put-call ratios fell to new relative lows this week. The weighted ratio was at its lowest levels since November 2021. The standard ratio fell below the lows of this past January. When they are at or near the lows of their charts they are signaling that the stock market is in overbought territory. Then, both ratios curled up just a little, but it is noticeable on their charts. Now, the computer analysis programs that we use for the ratio charts are "saying" that these are on sell signals for the stock market that is, they are expected to rise from here. After an unsuccessful sell signal at the beginning of the year (unsuccessful in terms of $SPX perhaps more successful in terms of IWM), we are not going to rush into a bearish position here unless we see these ratios begin to rise and trend higher. Still, this could develop into a full sell signal soon.
Breadth has just not been all that great for quite some time now. Recently, though, the breadth oscillators had moved to buy signals with some strong positive action between February 8th and 15th (see the Table on Page 1). However, breadth was just not as strong as one would want to see with $SPX making new all-time highs. This week has led to a more negative breadth reading, and these oscillators are toying with sell signals. But those sell signals have not been confirmed yet.
$VIX hasn't reacted much to any of the short-term weaknesses in the broad market, except for the one big market selloff on February 13th, after some unwelcome CPI figures. $VIX rose to almost 18 intraday, but then quickly fell back, creating a "spike peak" buy signal, which is currently in effect. These signals last for 22 trading days, unless $VIX closes back above its most recent peak (at 17.94).
So, we are maintaining a "core" bullish position and are rolling calls up as they become deeply in-the-money. While there is the possibility of sell signals from equity-only put-call ratios and breadth, they have not been confirmed yet. When they are, we will trade those and any confirmed signals around our "core" position.
This Market Commentary is an abbreviated version of the commentary featured in The Option Strategist Newsletter.

© 2023 The Option Strategist | McMillan Analysis Corporation