
By Lawrence G. McMillan
This article was originally published in The Option Strategist Newsletter Volume 17, No. 23 on December 11, 2008.
December is the second most profitable month, on average, since 1950, according to the Stock Trader’s Almanac (Jeffrey & Yale Hirsch; John Wiley & Sons; http://www.stocktradersalmanac.com). (November is the best month, as far as $SPX is concerned). However, there is usually a lot more going on than that during December. In this article, we’ll look at some of the more prominent factors influencing markets. First, we’ll see if there is any discernable pattern in the wellrecognized post-Thanksgiving rally. Next, we’ll try to ascertain if tax selling this year will be meaningful. Also, it’s less well known that volatility generally decreases in December, so we’ll look at that, too. And finally, we’ll try to assess the prospects for some of the traditional seasonal patterns, such as the Santa Claus rally and the January effect (which typically takes place in December, if it takes place at all).
December Rallies
As noted above, December is the second strongest month overall. A related notion is that there is usually a post- Thanksgiving rally. So, we tried to quantify that post- Thanksgiving rally. Table 1 shows the peak date in December, the $SPX point and percentage advances from the close of Wednesday just prior to Thanksgiving.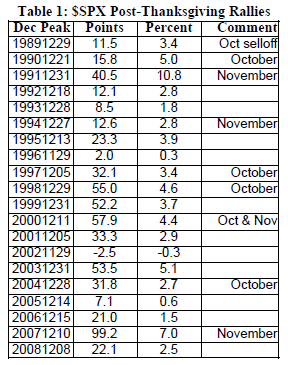
This table shows the results at the maximum gain for December. In reality, one would rarely, if ever, attain that maximum gain. But it is useful in showing the size and duration of the post-Thanksgiving rallies. This year, admittedly, may be different than any other in the past, but it is interesting to note that only four years showed selling in November, prior to the December rally. In two of those cases, the December rally lasted the entire month (1992 and 1994), while in the other two, the rally was over by mid-December (2000 and 2007).
The only losing year was 2002. In that year, the market had rallied in both October and November, and was pretty much straight down through December, as it was heading for a retest of that bear market’s lows.
The rally so far this year has been mild (most of the current rally occurred just before Thanksgiving). However, if the current rally can persist for another few days, history indicates that it has a good chance of extending through the entire month.
Tax Loss Selling (and the January Effect)
Almost every year shows some tax loss selling. The term applies to the act of selling some losers near year end to offset gains taken on winners earlier in the year, thus avoiding having to pay capital gains tax.
In many years, tax loss selling is not a major contributor to market action, although it certainly occurs each year. Using data once again from the Stock Trader’s Almanac, tax loss selling hasn’t been a large factor in the last four years. However, from 1999 through 2003 (Decembers), there was a huge rebound in stocks that had been depressed by tax loss selling.
In my opinion tax loss selling this December will be related to how large the gains are, if any, from selling that occurred earlier this year. We certainly know there has been plenty of selling so far this year. But did that selling produce capital gains or losses? The heaviest selling took place below the 1250 level on $SPX. Prior to this year, $SPX last traded at that level in mid-2006. Moreover, the most violent selling occurred this year after $SPX broke down below 1100 in early October. The last time $SPX traded there was all the way back in August, 2004. So, essentially, any stocks bought in the last four years were probably sold at losses (on average). Thus, an argument can be made that traders have generated a lot of losses by their selling this year – a fact which might not lead to much tax loss selling in December at all (there is no reason to generate more losses, if you already have more than you can use on your 2008 Schedule D).
Note that sales of partial positions can be applied to the highest purchase price. For example, if you bought 100 IBM at 50 in 1998, and bought another 100 shares at 110 in 2007, and then sold 100 at 80 this fall, you’d apply the sale to the purchase at 110 in 2007, rather than take the taxable gain on the 1998 purchase. This further strengthens my argument, since all fixed “buy stock monthly” plans were buying plenty of higher-priced stock from 2005-2007 – and that stock would be the first applied to sales from October or November, 2008, thus creating capital losses, not gains.
Of course, this is just our estimate. There is no real way of knowing the true position of millions of taxpaying investors.
The reason that traders pay attention to year-end tax selling is more for the purpose of trading individual stocks than the broad market. That is, if a small – and possibly illiquid – stock sells off sharply on tax loss selling, then it is likely to bounce back as soon as that artificial supply exhausts itself. Astute traders often look to buy such stocks near year-end and flip them out in early January.
The January Effect
When this effect is broad and encompasses a wide array of small-cap stocks, it is called The January Effect. When the effect was first “discovered,” back in the 1970's and ‘80's, small cap indices clearly outperformed big-cap indices at the beginning of January – for the reasons noted above. However, as more and more traders became aware of the January Effect, they rushed to buy the small cap indices earlier and earlier. This eventually forced the January Effect into December!
For a number of years, it was quite viable to trade the Value Line Index ($VLE) as a proxy for small-caps against $SPX, a proxy for large-caps. We still use that index as a proxy, even though trading products on Value Line have waned ($RUT or $SML products are used to trade “small-caps” currently). The graphs on the right show, though, how the entire relationship has deteriorated and become watered down.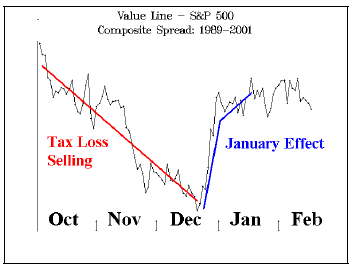
Through the year 2001 (above graph), there was a clear under-performance by small caps and then – in late December – a clear out-performance. We mentioned earlier that there hasn’t really been a lot of tax-loss selling for the last four years. In fact, the opposite has occurred: small-caps have recently been outperforming big-caps throughout November and early December, for the last few years. As a result, there really isn’t an underperformance heading into mid-December, but there is still an out-performance by small caps that might be tradable.
To summarize, there really hasn’t been a lot of tax loss selling for the last four years, but that could be because the bull market was so strong that traders didn’t have a lot of stocks held at losses. That has changed this year, but our view is that most of the selling has already taken place. There is unlikely to be any need for further selling because of taxes.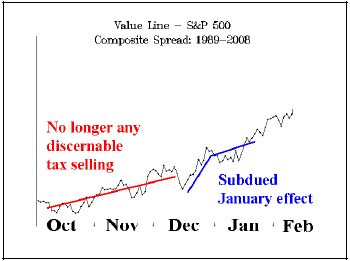
The Seasonality of Volatility
Volatility – as measured by $VIX – has a certain seasonality to it. The third chart on the right shows the composite chart of $VIX, by trading day of the year, using data from 19 years (1989 through 2007). For example, we took the $VIX prices on the first trading day of each year, summed them and divided by 19.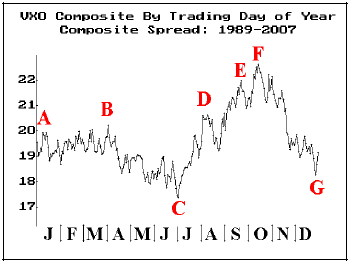
Several points are marked on this chart. Point “C” indicates that volatility usually makes it yearly low right around the 1st of July (the low this year occurred in May, and was nearly as low again in August). Also, $VIX then increases throughout the fall, peaking in October (that was the case so far this year). Both of those facts are not particularly surprising to most traders. However, many are not aware of the volatility “drain” that takes place during the fall of the year. Point “G” shows that, normally, $VIX has dropped almost back to the yearly lows by the time Christmas arrives. That won’t happen this year, of course (there is no way $VIX is going to drop from 50+ to 20 or so in the next two weeks), but it does show that there is generally pressure on $VIX until near the end of the year.
At this point in time, $VIX is at something of a crucial juncture. If it falls much from here, it will break through the bearish uptrend that exists on its chart (see page 11). That would have bullish implications for the stock market as a whole. So, the bulls may be getting some unexpected help from seasonality – call it a “Santa” seasonal, if you will.
The Santa Claus Rally
As longer-term subscribers know, the media often confuses the various terms regarding holiday seasonal trading patterns. The “Santa Claus Rally” specifically refers to the period encompassing the last 5 trading days of one year and the first two of the next year. It’s generally bullish, but when it’s not (like last year), then watch out below! We’ll be watching closely again this year, for we don’t think the bottom is yet in place.
This article was originally published in The Option Strategist Newsletter Volume 17, No. 23 on December 11, 2008.

© 2023 The Option Strategist | McMillan Analysis Corporation