
By Lawrence G. McMillan
I thought it might be interesting to see how previous $VXO/$VIXMO sell signals have played out. We have written plenty about this particular signal, which occurs very rarely – only when $VIX is near the 10 area, which is had been for a while now. The actual signal is this:
when $VXO closes below 10 and $VIXMO closes below 10.5,
that is a short-term sell signal for the stock market.
Once the signal is given, $SPX usually declines sharply, almost immediately, but the decline is short-lived.
I am not going to go over the system parameters again, except to say that there can sometimes be a group of signals, which eventually result in the sharp, short-lived downward move.
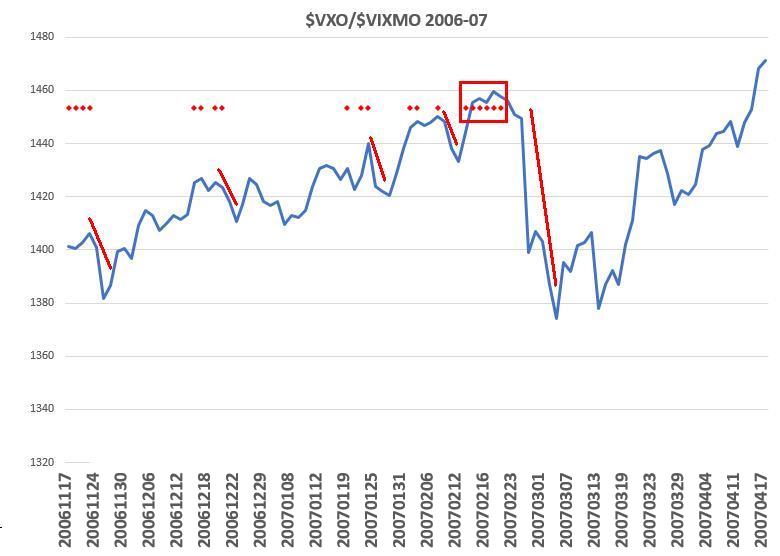
One of the more interesting times occurred in late 2006 and early 2007. There was a series of sell signals, and then a very stubborn market registered this condition for six days in a row, right before a large market drop and therefore one of the biggest gains for this system (a 50-point drop in $SPX). Figure 5 shows red dots for days when the sell signals occurred in late 2006 and early 2007.
If the market declined, the thick red descending lines show the market drop after the signals. While the market declines were subdued for the signals in November 2006, December 2006, January 2007, and early February 2007 each one did precede a slight market pullback. But then the afore-mentioned series of six signals occurred in a row in mid February (the row of 6 dots, nearly side-by-side are in the rectangular box in Figure 5), while the market kept going higher. Eventually, though, in late February, the big break occurred in the market...
Read the full feature article (published 6/16/17) by subscribing to The Option Strategist Newsletter.

© 2023 The Option Strategist | McMillan Analysis Corporation