
By Lawrence G. McMillan
Reference was made in Friday's Weekly Commentary to the fact that the weighted put-call ratio is at its lowest levels since November 2014. The long-term weighted put-call ratio chart – dating back to 1998 – is shown in Figure 5. In the 2002 bear market, the readings were astronomical, but since then, the ratio has ranged roughly from 50 to 130, except for some very bearish markets. The lows have slowly crept higher over the years, which is understandable, as more people have come to rely on put buying as a routine “insurance policy.”
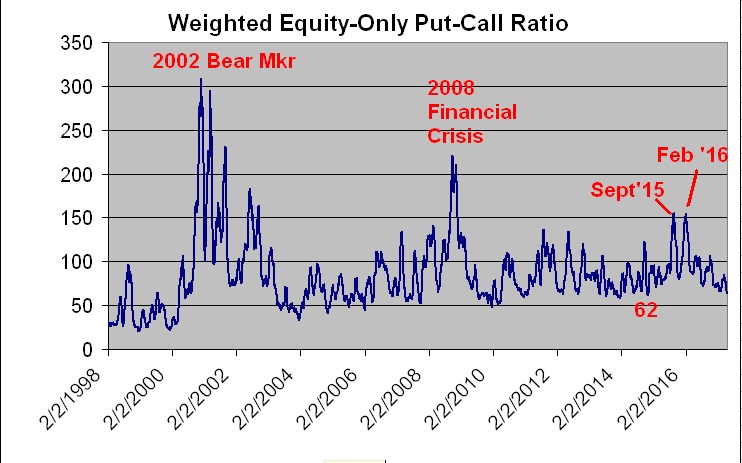
Currently the ratio is at 65, and in November 2014 it was as low as 62. Prior to that, previous lows were registered in January 2014 and April 2010. So its currently low level is significant. Does this mean another bear market is starting? Hardly. We certainly didn’t have one after November 2014, but what we did have was the market failing to make any significant progress for almost two years after that (red horizontal line Figure 6).
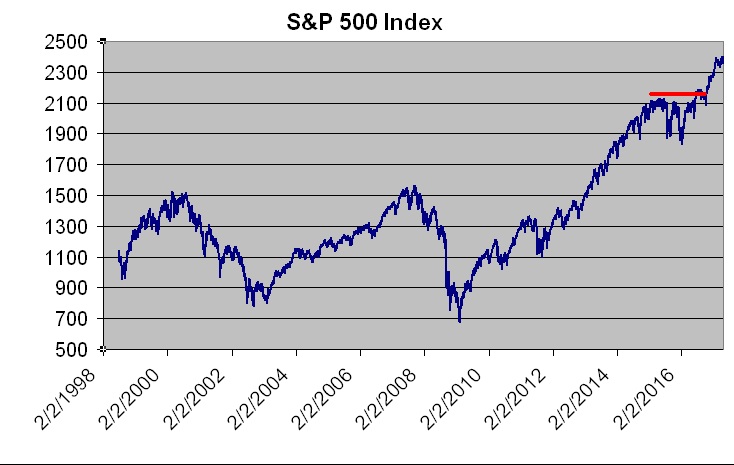
I don’t think we can necessarily make a similar conclusion of multi-year $SPX stagnation now – the data is insufficient. These put-call ratios remain most valid as short- to intermediate-term indicators. But the fact that we are making multi-year lows on the weighted ratio should not be overlooked, even if it is only as an intermediate-term signal.
This article was featured in the 5/19/17 edition of The Option Strategist Newsletter.

© 2023 The Option Strategist | McMillan Analysis Corporation