
By Lawrence G. McMillan
This article was originally published in The Option Strategist Newsletter Volume 3, No. 22 on November 17, 1994.
Traders in all markets often attempt to determine if a rally or decline has moved "too fast". If a rally has moved "too fast" or gotten ahead of itself, one often say that the stock or futures contract is overbought. Similarly, if a decline has been "too steep", then the underlying security is oversold. The hard part comes in determining what is "too fast" or "too steep". There are many technical indicators that attempt to measure the rates of advances and declines in order to determine overbought or oversold.
We prefer to use a modified Bollinger Band approach. On our graphs, you will often see "wavy" lines surrounding the actual prices. These represent 3- and 4-standard deviations about the 20-day moving average. If a stock or futures contract is more than 3 standard deviations above its moving average, and certainly if is more than four, we say it is "overbought". If it is that distance below its moving average, we say it is "oversold".
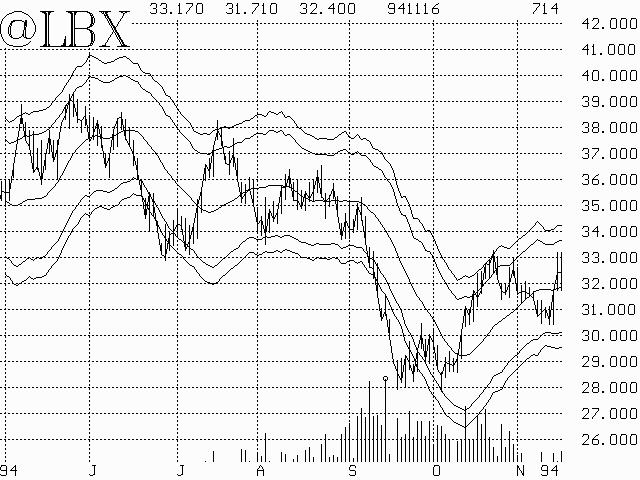
The graph above is that of November ('94) Lumber. It shows both the rewards and pitfalls of trading based on overbought or oversold readings. Notice that, most of the time, whenever Lumber rallied to the upper band, it was overbought, meaning that we could have sold it short and made money. Similarly, most of the time, whenever it hit the lower bands and was oversold, it rallied so we could have bought it and made money. Unfortunately, the system is not foolproof, as can be seen by observing what happen-ed when the lower band was reached in early September at 320 (32.0 on the chart). Rather than rally, it fell an additional 40 points to 280 before stabilizing. To mitigate this, we prefer to see a security that has traded outside of the outer bands, reverse to the inner band before buying. Thus we would not have bought Lumber until it traded up through the inner band at 390-395 in late September.
This article was originally published in The Option Strategist Newsletter Volume 3, No. 22 on November 17, 1994.

© 2023 The Option Strategist | McMillan Analysis Corporation