
By Lawrence G. McMillan
This article was originally published in The Option Strategist Newsletter Volume 5, No. 19 on October 11, 1996.
We often refer to implied volatility and its uses. However, it's been some time since we actually discussed the use of implied volatility as a predictor of market movement. Consequently, we have received number of subscriber requests for this information and have decided to satisfy those requests with this article. The gist of this article is to use implied volatility as an impetus for directional trading — i.e., to use it to predict where the underlying market is going to go, and then to make an outright buy or sell in that market. This is as opposed to trading volatility itself, which is a neutral strategy (that theoretically doesn't try to predict the direction of the underlying market at all). This latter concept results in the type of strategy offered under "Trading Volatility".
The CBOE's Volatility Index ($VIX) is a good predictor of overall stock market movement. This is a simple, but powerful, concept that is becoming more widely known and used. Essentially, the concept is a contrarian one. When the market falls, people begin to panic — mostly in the form of overpaying for put options — and, as a result, implied volatility increases. $VIX, which is a numerical measure of implied volatility, rises to extremely high levels. Conversely, when $VIX peaks and begins to fall, that is usually a good buy signal for the overall stock market.
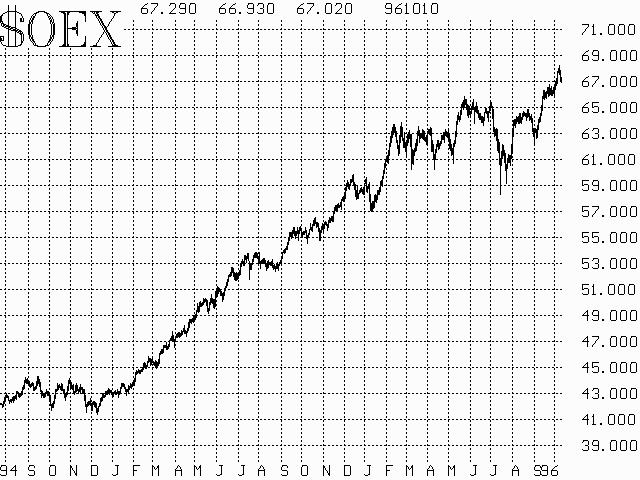
The charts below demonstrate the results of this approach over the last two years or so. Peaks in $VIX are marked with a "B" (for buy) and the same point in time is marked on the accompanying chart of $OEX. These are excellent buy signals. It is interesting to note that one does not use a specific level of $VIX, but rather looks for extreme peaks wherever they occur. Thus, back in 1994 and 1995, peaks in $VIX occurred at absolute levels in the 16% to 18% range. However, now that volatility levels have increased in general, peaks in $VIX in 1996 have been at levels well above 20%. This is a good reminder of how to interpret almost any technical indicator that attempts to measure overbought/oversold or extremes in sentiment — a dynamic approach is best, rather than just using a fixed level as a buy or sell signal.
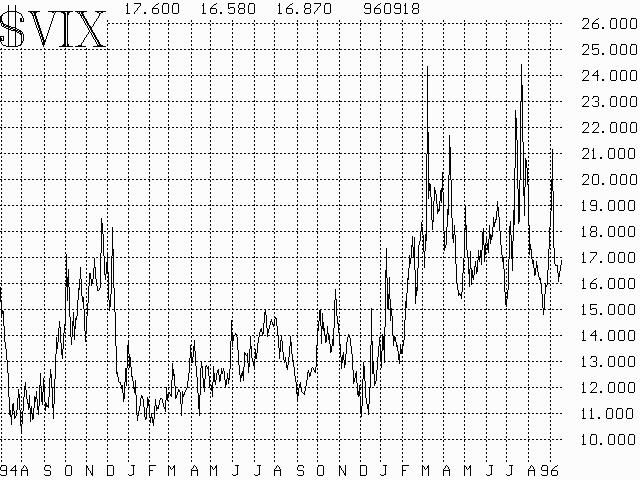
Notice that the peaks in $VIX are rather "pointy". They occur quickly. This is because they are measuring panicky sentiment, which disappears quickly when the market begins to rally. The real usefulness of the $VIX as a buy signal is that the market moves which follow are rather large — not just a rally for a day or two.
It should be noted that interpreting the $VIX in this manner is a contrarian method of investing: when the "average" guy is panicking and buying puts, we — as contrarians — are thinking about buying the market on the long side. Of course, now that more and more people are becoming aware of this phenomenon, there is a chance that the signals will become distorted. Or, as often occurs, a bad signal will occur to punish the new "converts". Look at what happened in July as some evidence of this. The first peak in $VIX occurred at 22.5% on about July 10th. Then, just a week or so later, $VIX roared through that level to the real peak at 24.5%. On or about July 10th, I saw several articles on the Internet and elsewhere that recommended buying the market because $VIX had peaked. And, as is common in that venue, there were all kinds of fancy math methods to determine that a peak had, in fact, occurred. These guys took a beating over the next week or so before the market bottomed. In that particular case, the market was very oversold by other measures and, when it is that oversold, there is usually a re-test of the bottom (which is what occurred on the second $VIX peak at 24.5%), so it is often useful to add some common sense or experience into the mix. In any case, though, it is obvious from the above charts that peaks in $VIX are good buy signals.
Having established that extreme peaks in $VIX are good buy signals, can we then conclude that extreme low readings are good sell signals? That answer to that one is an emphatic "No". The troughs in $VIX are marked with the letter "X" on the above charts. When volatility is low, it normally precedes an explosive move by the market, but that move can occur in either direction. Many times that move is to the downside, but there have been some spectacular moves to the upside after low $VIX readings as well. The proper strategy to establish when $VIX is extremely low is to buy straddles — buy both a put and a call with the same terms.
Once again, we look for low points on the $VIX chart on a relative basis, not at absolute levels. Thus, back in 1994 and 1995, troughs occurred with OEX down near the 10% to 11% area. However, in 1996, low $VIX readings are more commonly in the 15% to 16% area. There are seven signals marked with "X" on the above charts. Five times the market moved lower (including all of the signals in 1996), but in February, 1995, and September, 1995, low $VIX readings preceded large rallies by the market. Thus, the proper strategy is shown to be that of purchasing straddles.
At the current time, $VIX is at fairly low levels. This means that one should be alert for a fairly large market move.
This article was originally published in The Option Strategist Newsletter Volume 5, No. 19 on October 11, 1996.

© 2023 The Option Strategist | McMillan Analysis Corporation