
By Lawrence G. McMillan
This article was originally published in The Option Strategist Newsletter Volume 24, No. 8 on April, 23 2015.
One of the most successful investment strategies practiced by hedge funds (and other sophisticated investors) in the last ten years has been the “volatility short” trade. It is rarely mentioned on TV or in the media, but that is not too surprising. They would rather promote things such as the “Japan carry trade,” which wasn’t necessarily a profitable strategy at all unless a great deal of risk was taken. Not to say that the “volatility short” didn’t have its own share of risk, but it’s a lot more certain to profit if a certain status quo is maintained.
In this article, we’ll look at the history of the “volatility short” trade and see where it stands today. The long-term perspective on this trade may be a bit surprising, for it shows the tremendous toll that the $VIX futures premium takes on a long volatility position.
Background
$VIX futures were first listed in 2004. They had really been planned to launch in 2003, when the “old” $VIX – based on $OEX options – was replaced by the “new” $VIX, based on $SPX options. However, there was a problem designing the $VIX futures so that market makers could hedge them with a relatively easy degree of simplicity. Without the ability for market makers to arbitrage their positions (i.e., hedge them “perfectly”), no market will attain a high degree of liquidity. The design that the CBOE came up with is the same one we have today: the futures are based on the one strip of $SPX options that expires 30 days after the futures themselves expire. This has indeed provided the framework for market makers to hedge themselves, and hence the $VIX futures market is a liquid one.
The original $VIX (based on $OEX options) is still broadcast by the CBOE, under the symbol $VXO. In 2014, another change was made to the $VIX calculation, and so the one created in 2003 now trades with the symbol $VIXMO. This change (in 2014) in the way $VIX is calculated did not change anything about the $VIX futures.
Term Structure
“Term structure” is an expression that describes the relationship of the $VIX futures to each other. In a “normal,” bullish market, the term structure slopes upward. That is, the near-term futures are the lowest price, then the next month is priced somewhat higher, and the month after that even higher, and so forth.
But when the market becomes more apoplectic, the term structure will flatten out. If a true bear market develops, the term structure will actually invert.
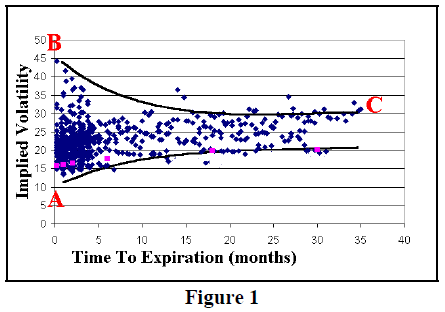
Figure 1 shows a snapshot of $OEX option implied volatilities some time ago. We have published this graph before, but it suffices to describe the term structure. Very short-term options can have implieds that are scattered all over the place. In bull markets, they could be as low as 10%; and in bear market as high as 45% (points A and B on the chart).
However, longer-term volatilities are harder to predict, so whether it’s a bear market or a bull market, the market makers will tend to price long-term options (say, three years until expiration) with an implied volatility that is more or less “average.” That is point C on the chart.
Table 1 shows the current term structure. Note how each futures contract is higher priced than its immediate predecessor. That is a positive-sloping term structure and is indicative of a bullish market.
In addition, though, notice how large the premiums are. The term structure can slope upward without such large premiums on the futures. These large premiums are reflective of the fact that $VIX is currently very low (i.e., short-term volatilities are low). But as market makers are forced to guess at what volatilities are going to be in later months, they tend to price each month more towards the longer-term average.
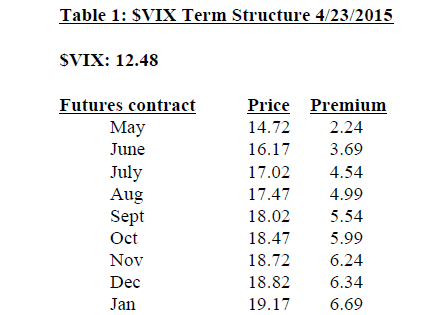
This is the basis for the “short volatility” trade. If the stock market continues to rise, and all other things remain normal, these futures premiums will decline as time passes. For example, if one were to short the May futures now, at 14.72, and nothing changed, they would eventually decline to meet $VIX at 12.48 at May expiration.
Longer-term futures would behave in a similar manner. If one were to short, say, the September futures at 18.02, and there wasn’t an untoward bearishness in the market between then and expiration, then those futures would decline in a relatively straight line towards $VIX at September expiration.
When the $VIX futures were first listed in 2004, a bull market was underway, so the term structure sloped upward. Moreover, premiums were rather large, partly because there had been a good deal of publicity about how owning the futures could provide protection to a stock portfolio. That is true, but if one overpays for that protection, it is inefficient. That’s exactly what happened back then, as even the near-term futures traded with premiums of 4.00 points or more.
I have carefully saved all of the $VIX futures prices since inception. Figure 2 shows all of the futures prices from the beginning of trading in March 2004, going forward about one year.
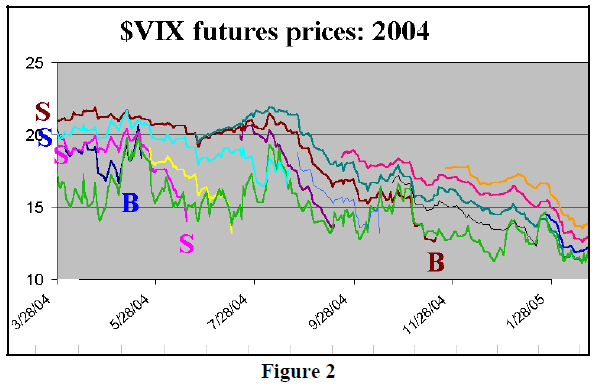
On Figure 2, each colored line represents a futures contract (similar to the “usual” graph on page 12, that we publish in each issue). Moreover, I have marked three of the potential short sales, so that you can see how far the futures actually fell. The brown line is the November 2004 futures contract. The blue line on the left of the chart is the May 2004 futures contract, while the pink line is the August 2004 contract. The green line is $VIX.
All three started out, in March 2004, at about the same price – near 20. $VIX was about 16 at the time, so that you can see they all had premiums of around 4.00 points.
The “S” for “sell” on the left of the chart shows where a potential volatility seller could have sold the contracts in March 2004. $VIX was rather well-behaved as the bull market persisted in 2004, and there were no sharp spikes or other upward trends to speak of. As a result, each of those three futures contracts eventually was much lower by expiration – where I have marked a “B” for “buy to cover” on each line. The May 2004 futures (blue line) were covered at about 17; the August 2004 futures (pink line) were covered at about 14, and the November 2004 futures (brown line) were covered at about 12. A $1,000 per point per contract, those are healthy profits.
That, in essence, is the “short volatility” trade. It was pursued heavily by hedge funds until it imploded (as $VIX exploded), first in 2007, and then most noticeably in 2008.
If you take nothing else away from Figures 1 and 2, please take this: just because, say, six-month $VIX futures are trading at higher prices than near-term $VIX futures, it does not mean that “traders” are predicting that volatility will be higher six months from now. Those higher six-month prices are merely a function of the normal workings of the market – the term structure. I have seen traders on TV get this wrong repeatedly (shame on them). The same mistake is made by media types about Crude Oil futures, whose futures’ term structure also slopes higher at this time.
After the “shock” of the financial crisis, traders did not flock back to the “short volatility” trade as easily. But since the market has been steadily rising since early 2012, the “short volatility” trade has been working again, and so it is being pursued, but generally in a more conservative manner than it was in 2004-2008.
The “short volatility” trade for retail
Even retail traders have been participating in the “short volatility” trade for the past few years. They may not exactly realize that’s what they’re doing, but they are.
Again, let me present a little background: in January 2009, just two months before the bottom, Barclays introduced the first Volatility ETN – VXX. The undelrying securities for VXX are the two front-month $VIX futures. So Barclays owns both of those futures, and the quantity of each is determined by the same formula used to weight the two strips of $SPX options that are used in the formula to calculate $VIX.
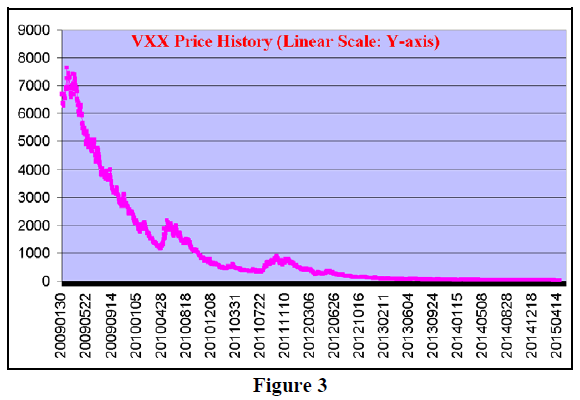
But since Barclays is constantly owning all of this futures premium, VXX is actually on the opposite side of the “short volatility” trade. Figure 3 is an eye-opener. It is the price of VXX since inception, with all of the reverse splits included. That is, as VXX loses value because of the grind of losing the time value premium of the $VIX futures, Barclays has reverse split it several times to get its value back up to a “normal” level.
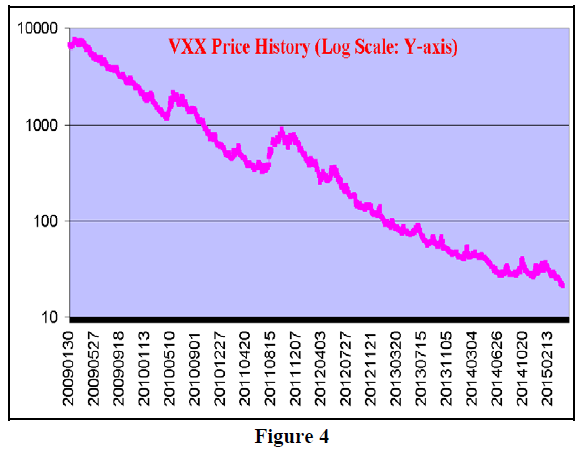
Figure 3 shows the price history of VXX on a linear scale for the Y-axis, while Figure 4 shows it on a logarithmic scale. Essentially VXX has fallen from a price of 6700 to 21 – a loss of 99.7%!!!! Now that’s a short sale!
In late 2010, the inverse VXX, or XIV (VIX spelled backwards) was introduced. It performs the opposite from VXX each day. This is where retail has generally been participating in the “short volatility” trade – by owning XIV.
We have produced several articles in the past few years that have described the behavior of VXX, XIV, and $VIX. These are our observations summarized:
- In a bullish market, when the term structure slopes upward, XIV will outperform $VIX, and VXX will underperform $VIX.
- In a bearish market, when the term structure slopes downward, VXX will outperform $VIX, and XIV will underperform $VIX. NOTE: this item (2) means that you can’t just stay short volatility all the time, for in bearish markets, you could suffer large losses.
- The best way to “short volatility” with these products is to short VXX; that performs better than being long XIV.
Finally, since VXX has options, a safer way to “short volatility” is to own VXX puts, because in case some overnight volatility explosion takes place, your losses would be limited. Whereas, an actual short sale of VXX (or a long ETN position in XIV) could have devastating losses in a sudden – even overnight – volatility explosion.
It is for these reasons that we maintain a long put position in VXX, in Position S761, much of the time. However, the implied volatility of VXX options is high – typically running 50% implied volatility or higher – so time value premium expense can be substantial as well.
Regardless of how you approach it, what should one watch for as a warning sign that it’s time to exit the “short volatility” trade? It would be a flattening of the term structure in one of two ways: 1) the front month $VIX futures trades at a higher price than the second month $VIX futures, or 2) $VXST (the CBOE short-term volatility index) rises above $VIX.
In summary, the “short volatility” trade is a viable approach, but one must be careful to not get overly complacent with the trade.■
This article was originally published in The Option Strategist Newsletter Volume 24, No. 8 on April, 23 2015.

© 2023 The Option Strategist | McMillan Analysis Corporation