
By Lawrence G. McMillan
We continue to get questions regarding why the $VIX futures are priced as they are, and how one should interpret that information. This is a subject that we have discussed many times in the past, but it is probably worthwhile to review it again.
There are two significant pieces of data that one should always be aware of, when evaluating $VIX futures:
1) the relationship of the futures to $VIX itself,
and 2) the relationship of the futures prices to each other. We refer to the construct of the $VIX futures to be the term that encompasses both of these data items.
- Premium: when we compare the $VIX futures to the price of $VIX itself, we are concerned mostly with whether the futures are trading at a premium to $VIX or a discount. By a “premium,” we mean that the futures are trading at higher prices than $VIX. By a “discount,” we mean that the futures are trading at prices lower than $VIX. In general, during bullish times, the futures will trade at premiums, and during bearish times they will trade at a discount – or at least the first several months will.
- Term structure: the term structure refers to how the futures are priced with respect to each other. For example, if the nearest-term futures is trading at the lowest price, and then the next month is at a higher price, and each successive month is trading at a higher price than its immediate predecessor, we say that the term structure is sloping upward. This happens during bullish times.
Conversely, if the near-term future is trading at a higher price, and each successive futures contract is trading at a lower price than its immediate predecessor, we say the term structure is sloping downwards. This happens during bearish times.
We eschew traditional commodity terms “Contago” (even though it’s neat-sounding) and “Backwardation” to describe the term structure, because most people don’t know what they mean, and – even if they do – they have to stop and think which one means the term structure is sloping upwards and which one means it’s sloping downwards.
A subscriber asked this week, “Why do the futures line up in these ways, and why is an upward slope bullish, while a downward slope is bearish?”
The reasons for these constructs being bullish or bearish are somewhat complicated and we have written about them (and lectured about them) often in the past.
Briefly, long-term volatility is always priced more or less at the "average" because no one knows what it will be. Near-term volatility can range all over the place. In bullish markets, actual volatility and near-term implied volatility are low, while long-term volatility is "average" (higher) and so the term structure slopes upward. In a bearish market, near-term volatility is higher than the average, and so the term structure slopes downward.
This can often be best demonstrated through a graph. The accompanying Figure 1 shows the term structure at four different times: near the worst of the 2008 Financial Crisis (10/9/2008), the day $SPX was down 80 after S&P downgraded debt (8/8/2011), which are both bearish; and then two bullish markets where $VIX was very low and the term structure sloped upward steeply: 1/10/2013 and 11/15/2013. You can clearly see the upward slope in bullish times and the downward slope in bearish times.
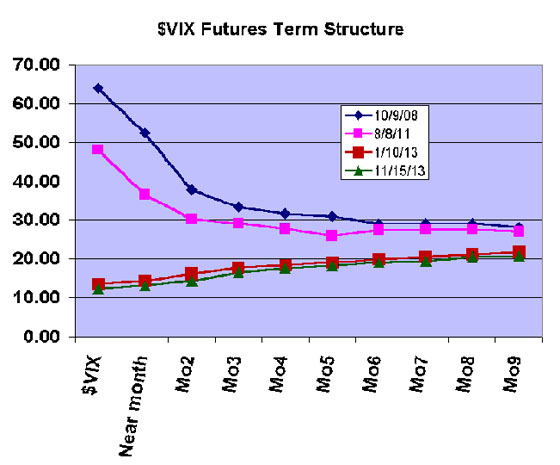
Notice that they all seem to be converging on about a 25 volatility on the right-hand side of the chart. In other words, no matter what is happening in the short term, market makers price long-term volatility for $SPX at about 25. Remember that $SPX options extend out about three years in time and we are only looking at 9 months here (which is as far as the futures extend out).
You can see from this graph that the longer-term futures markets are not predicting where volatility is going to be (as CNBC anchors and some other analysts often incorrectly imply). Rather, they are just “in line” from wherever near-term volatility is, connecting on out to long-term volatility somewhere in the mid-20's.
In fact, one of the more successful professional strategies has been to sell the mid-term futures during bullish times and then wait for them to collapse as they become near-term. Clearly that strategy wouldn’t have worked if the futures had really been forecasting a rise in volatility.
This article was taken from The Option Strategist Newsletter Volume 23, Number 5 (published on 3/24/14). Get all of the articles by subscribing to The Option Strategist Newsletter today. Introductory 3 month trial subscriptions are available for only $29.

© 2023 The Option Strategist | McMillan Analysis Corporation