
By Lawrence G. McMillan
Last year, in discussing the second possible longer-term path for the market, I said “if this scenario were to play out, the market would bottom sometime in early 2012, rally strong into 2013, and then collapse.” I am still sticking with that long-term forecast. We have been talking for years about the similarities between the current market (since the mid-1990's) and the stock market of 1966 to 1983. The primary feature of that past time period was three bear markets. We have also often talked about the fact that, after an upside explosion – bubble, if you will – such as occurred in the tech boom of the late 1990's,there needs to be a cooling off period of roughly 16 years or so. Since that bull market topped in 2000, we don’t expect the current market malaise to be over until at least 2016. Similar periods existed in 1907-1920 and also 1929-1946.
It is fairly normal for there to be a series of bear markets in those periods of hiatus, and that is why we continue to expect there will be another nasty bear market in the near future. This does not encompass any fundamental reasoning, but usually a full-fledged financial crisis occurs which takes a long time to work off. In effect, the deleveraging that needs to be done simply takes a long time to accomplish.
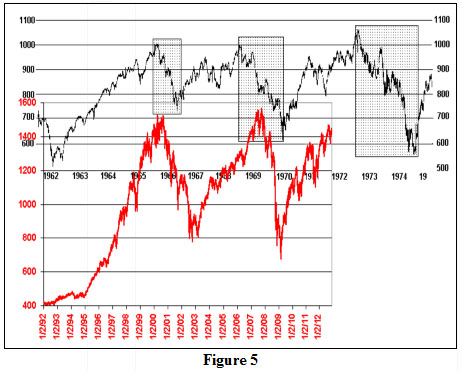
In Figure 5 above, there is one graph that has two long-term stock market charts overlaid – one above the other. The higher graph, drawn in black, shows the Dow-Jones Industrials from 1962 through 1974. The lower graph, in red, shows the S&P 500 ($SPX) from 1992 to the present...
Read the entire "2013 Market Forecast" article (published on 12/28/12) by subscribing to The Option Strategist Newsletter.

© 2023 The Option Strategist | McMillan Analysis Corporation