
By Lawrence G. McMillan
The gaps between historical volatility and implied volatility have never been larger. Furthermore, the gaps between $VIX and the intermediate-to-long-term futures have rarely been larger, as well. Trading desks around the street are aware of these facts and those with “volatility desks” are writing about the situation or making recommendations because of it. The one thing that no one seems to be addressing, though, is why the term structure of the futures is so steep and remains that way. In this article, we’ll address these facts and try to answer that question.
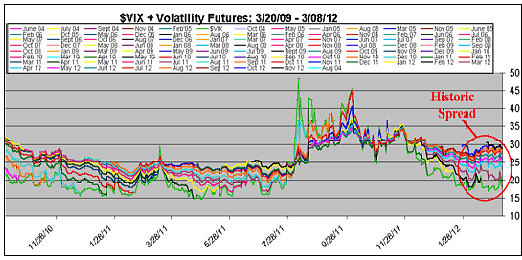
First of all, observe the graph below. The circled area shows how far apart the futures are spread right now – meaning that the term structure slopes upward very steeply. $VIX, the green line, is the lowest line and the futures prices climb upwards from there.
The only other times that the futures have spread out nearly this wide occurred in similar circumstance to where we are now – after a long, slow-moving rally in the stock market. In recent years, these very steep term structures go hand in hand with the “streaks” that the market has produced...
Read the entire Volatility and Variance Futures and Options Update: Term Structure At Historic Levels article by subscribing to The Option Strategist Newsletter.

© 2023 The Option Strategist | McMillan Analysis Corporation