
By Lawrence G. McMillan
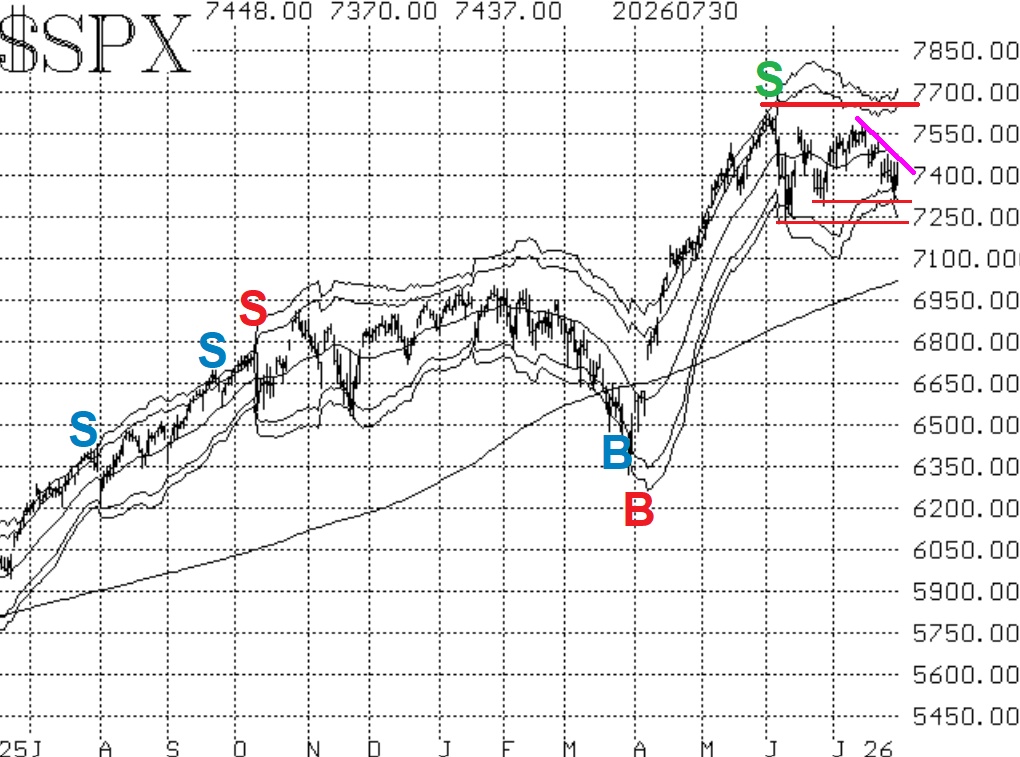
Despite one downward probe on July 29th, $SPX has managed to trade in a range and close at almost the same price every day. Near- term resistance is at 7430. After that failure on the 29th, the market bounced off the 7300 level with a vengeance the next day, so that is support. Even so, if one looks at the chart of $SPX in Figure 1, it is obvious that there is a new downtrend line that can be drawn, connecting the failed rally attempts that took place during July.
There is support at 7300 and then 7240, with potential further support near the rising 200-day moving average in the 7100 area (that area was also a short consolidation range back in late April).
This pattern is very similar to what we saw in the last half of June a short-term downtrend in $SPX with support near 7240 and 7300. It held then, and it might well hold again. The key may be what happens with $VIX and the implied volatility indicators.
Before we get to those, though, let's review the market internals. Equity-only put-call ratios continue to rise, even when the market has positive days. Thus traders are buying plenty of puts on stocks. This causes the ratios to rise and keeps them on sell signals for the broad stock market. These put-call ratios will remain bearish for stocks until they roll over and begin to decline.
Breadth was better this past week (except for the 29th), but it hasn't been strong enough to reverse the sell signals that continue to be in place for the breadth oscillators. Breadth is poor today (July 31st), so this situation isn't improving yet.
$VIX itself has been somewhat volatile, as traders with many kinds of backgrounds are wading into this market. $VIX closed at its highest level since early June when it probed up above 20 on July 29th. But it quickly fell back, so the trend of $VIX buy signal (pink "B" on the chart in Figure 4) remains in place. In reality, $VIX is not trending much of anywhere over the past several weeks similar to $SPX. But when $VIX is flat or trending down, that is an "all clear" for stocks to rise.
In summary, $SPX is still in a trading range. That may have taken on a slightly more negative slant this week, but so far support has held. We have not had any new signals from our indicators, but we will act on them when we do. Continue to roll deeply in-the- money options.
This Market Commentary is an abbreviated version of the commentary featured in The Option Strategist Newsletter.

© 2023 The Option Strategist | McMillan Analysis Corporation