
By Lawrence G. McMillan
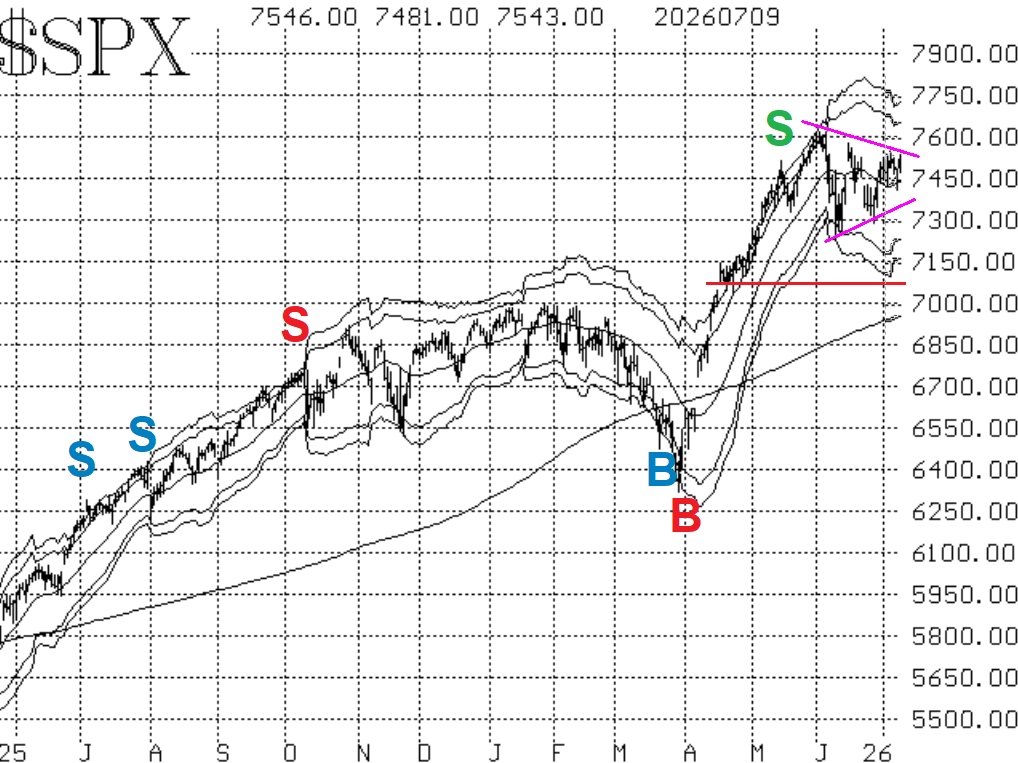
This week, $SPX has tried to break out over the top of the triangle formation that has inhibited price movement since early June. Indicators have improved somewhat, so that is certainly a possibility. However, the next resistance level at 7600-7620 is the all-time highs, and there would need to be a clear breakout over that level in order to turn the $SPX chart to a fully "bullish" status.
There is support at 7420 (tested briefly a couple of times in the past week), with strong support at 7300, near the bottom of the triangle. A move below 7300 would be quite negative, and would probably indicate a quick test of longer-term support in the 7050- 7100 area.
Equity-only put-call ratios have been rising for over a month, and that is a bearish weight on the stock market. Just in the past couple of days, the rate at which these ratios has been rising is diminishing. Thus, it is possible that they could be ready to roll over and begin to decline. That would be a bullish sign for the stock market if it indeed happens.
While the put-call ratio is improving, there has been some deterioration in breadth. That was enough to roll both breadth oscillators over to sell signals.
That brings us to the $VIX-related indicators. $VIX has been decreasing for the most part, and that is generally bullish for stocks. We have two buy signals (for the stock market) in place at the current time: the "spike peak" buy signal and the trend of $VIX buy signal.
So, the majority of the indicators are bullish, but we are still waiting to see $SPX break out to the upside. That confirmation will be needed for any sort of momentum bullish trade. Regardless, we will act on our indicators as signals are confirmed or as stops are reached. Continue to roll deeply in-the-money options.
This Market Commentary is an abbreviated version of the commentary featured in The Option Strategist Newsletter.

© 2023 The Option Strategist | McMillan Analysis Corporation