By Lawrence G. McMillan
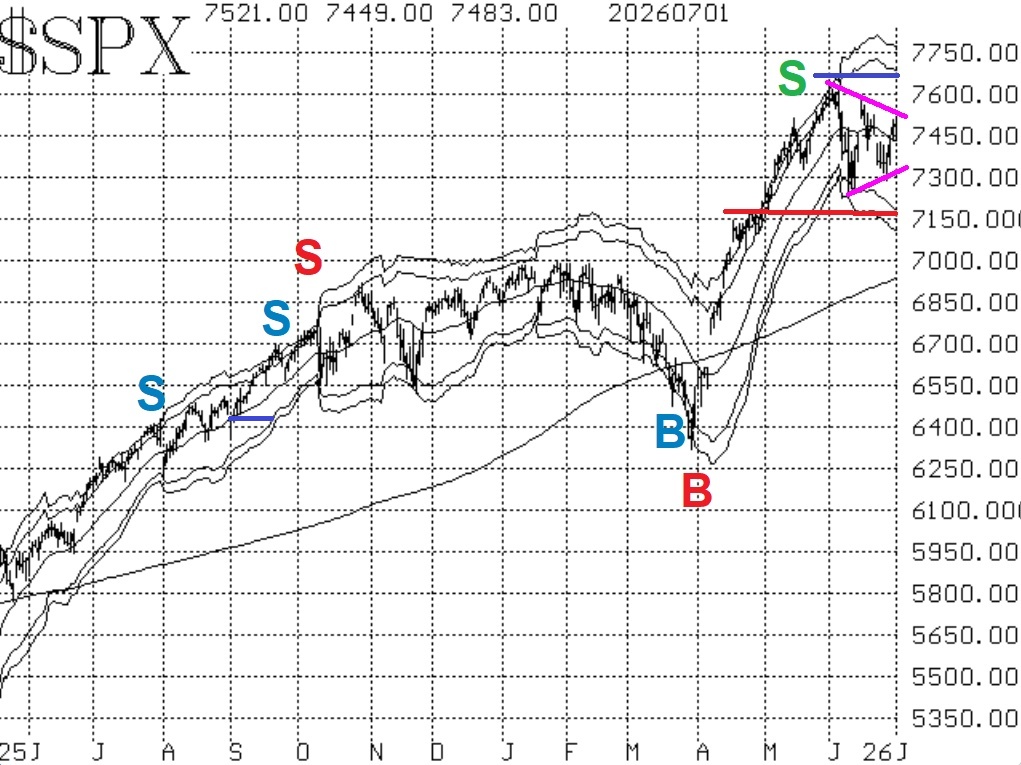
The market continues to consolidate in the triangle formation that we had pointed out previously. It is currently trying to break out on the upside. The pink lines on the chart in Figure 1 define the triangle. In a broad sense, a breakout above 7500 would be positive, or a breakdown below 7300 would be negative.
The equity-only put-call ratios are still rising (see Figures 2 and 3). That is, even though $SPX has rallied over the past few days, traders are still buying puts as hedges, if not necessarily for pure speculation. In either case, these ratios will remain on their sell signals for the stock market until they roll over and begin to decline.
A more positive note has been the improvement in breadth recently . The NYSE-based breadth oscillator has remained on a buy signal for a few weeks, but the "stocks only" breadth oscillator just recently joined in with a buy signal of its own.
$VIX has begun to drop again and is now below 17. That is enough to keep both buy signals that are related to the $VIX chart in place.
In summary, we have a bullish plurality from our indicators, but for a truly bullish move, we need confirmation from the $SPX chart -- first via a move above 7500 and then eventually a breakout to new all-time highs. In any case, we will follow the signals from our indicators, and we will continue to roll deeply in-the-money options where appropriate (there were several rolls in our individual equity call positions relative to put-call ratio buy signals in the past week).
This Market Commentary is an abbreviated version of the commentary featured in The Option Strategist Newsletter.

© 2023 The Option Strategist | McMillan Analysis Corporation