By Lawrence G. McMillan
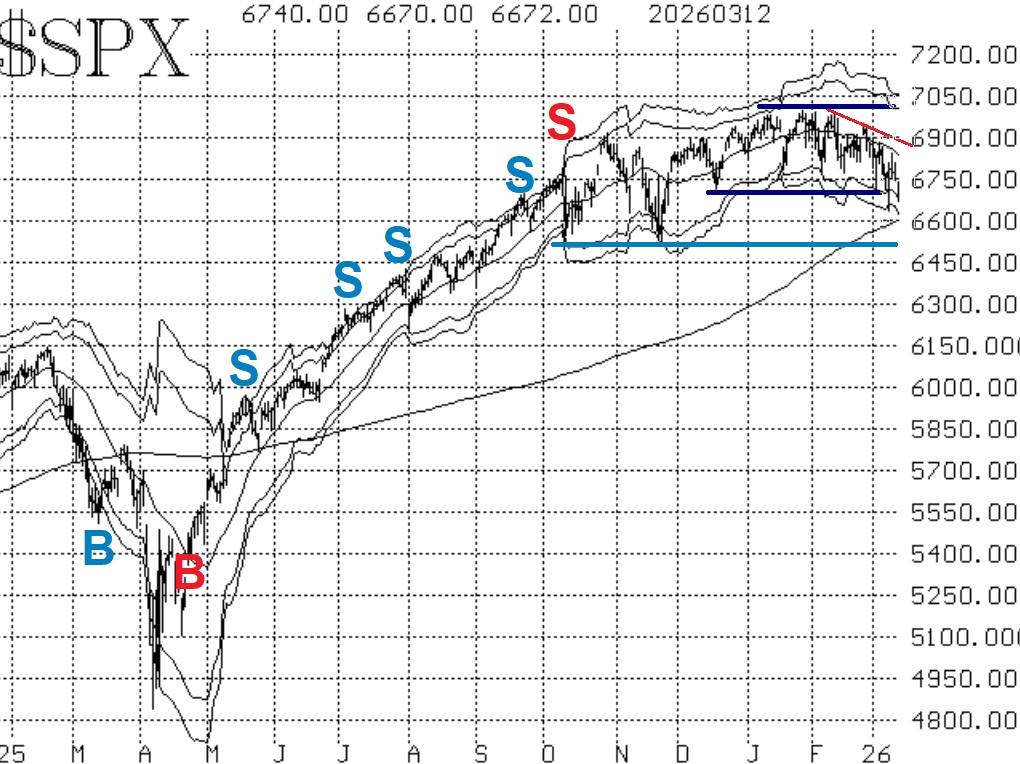
It certainly took a while, but $SPX has finally closed below its December low of 6720. On average, statistics show a further decline of 10% when that occurs. Sometimes these declines take months, or even a year or more. It doesn't necessarily mean that $SPX is suddenly going to drop 10%. But the target is now $SPX 6050, roughly. Of course, that's an average result.
Regardless, that fact coupled with the fact that the $SPX chart now shows a budding downtrend means that the $SPX chart is bearish. The next support level is the 6500-6550 area, which was tested a few times last October and November.
Equity-only put-call ratios continue to rise. There was a small downturn earlier this week, but now both ratios have made new relative highs, and that is bearish for stocks.
Breadth has been especially poor this week (see the Table on Page 1). As a result, both of the breadth oscillators are on sell signals. They are in fairly deeply oversold territory, but "oversold does not mean buy."
Meanwhile, there's a lot going on with the implied volatility complex $VIX and its associated products. First and foremost, the trend of $VIX sell signal (for stocks) is in place. The entire $VIX complex is bearish because of the upward-sloping term structures in the $VIX futures.
So, $SPX is now in a downtrend. The caution that was being exhibited by rising equity-only put-call ratios and rising $VIX since last December is now finally manifesting itself in a falling market. We will watch our indicators and take positions accordingly, while continuing to roll deeply in-the-money options.
This Market Commentary is an abbreviated version of the commentary featured in The Option Strategist Newsletter.

© 2023 The Option Strategist | McMillan Analysis Corporation