By Lawrence G. McMillan
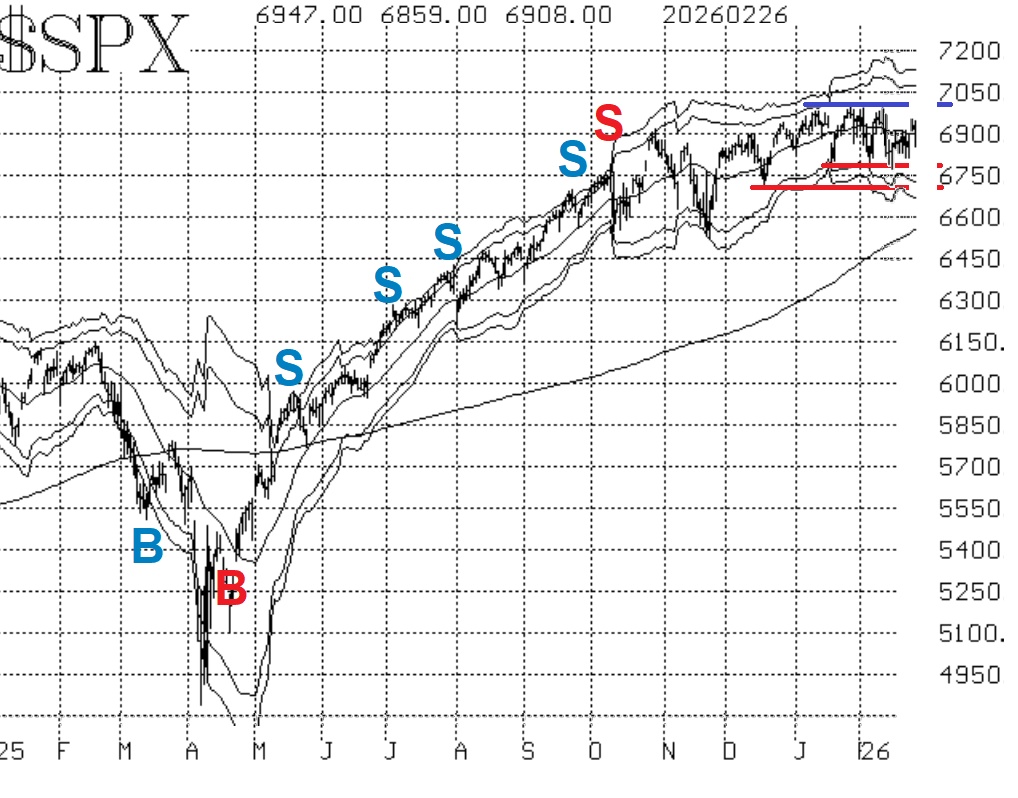
Despite some ugly days, or parts of days, $SPX continues to find support at or near 6800. On the other side of the range, sellers become more aggressive the closer that $SPX gets to 7000. The result is that $SPX is still trapped in the 6720-7000 trading range, as it has been since last November.
Swing traders continue to sell the highs and buy the lows of that range, figuring that eventually they'll have a losing trade when a breakout occurs, but so far it's been working out for them. Meanwhile, momentum traders await the said breakout, but it has not been forthcoming.
The fact that $SPX continues to bounce back and forth inside the trading range has caused a mixture of signals in our indicators, as is to be expected.
The equity-only put-call ratios continue to rise, and they are thus a bearish indicator.
Breadth has been positive this week. The breadth oscillators are not in agreement. However, cumulative breadth is much more positive.
This brings us to the volatility complex, where things are also "mixed." Most recently, there has been a new trend of $VIX sell signal. Opposing that, the "spike peak" buy signal of February 6th remains in place.
In summary, $SPX remains in the trading range, and the indicators are mixed. One could make a case for the bulls or the bears with about equal ease. We are waiting for a breakout and thus a momentum trade.
This Market Commentary is an abbreviated version of the commentary featured in The Option Strategist Newsletter.

© 2023 The Option Strategist | McMillan Analysis Corporation