By Lawrence G. McMillan
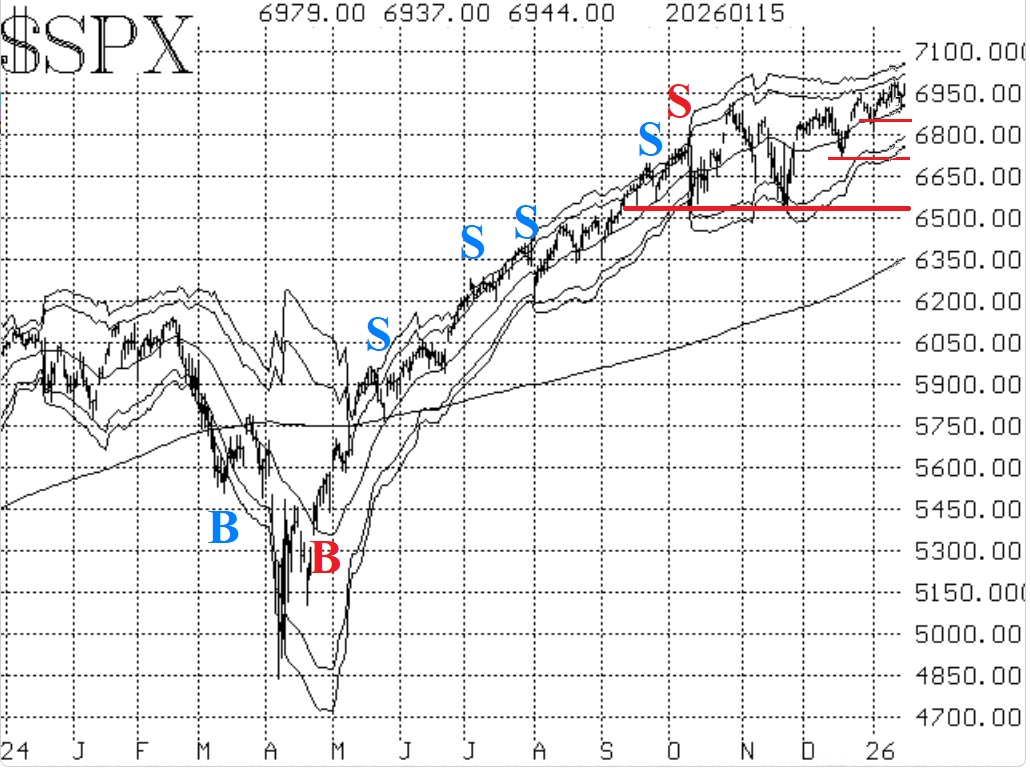
$SPX made another new all-time high on both January 9th and 12th -- the first time it's made new all-time highs on back-to-back days since last October. That would indicate a target of as high as 7300. A less aggressive target would the +4 sigma modified Bollinger Band at about 7050. There is now support at 6900, 6840, and 6720 (the recent lows of each pullback in the last few weeks). A move below 6720 would be very negative, though, because that is the December low. Meanwhile, there is small resistance at 6986 (the highs so far).
Most of the indicators are bullish now, but not the equity-only put-call ratios. They continue to rise, especially the weighted ratio. A rising ratio reflects heavier put buying than call buying, and while a trend is in place that is bearish for stocks.
The rally is broadening, and this is nowhere more evident than in market breadth. Even when $SPX sold off on a few days this week, breadth was quite positive. This has been reflected in the strong rally in the Russell 2000 Index ($RUT; IWM). Both breadth oscillators are on buy signals.
Implied volatility has been showing some signs of worry, though. Not enough to generate sell signals, but enough to show that traders are still cautious about this market. $VIX is generally low, and worries would only occur if it were to rise above its 200-day Moving Average.
In summary, things are still quite bullish. $SPX seems to be almost reluctantly progressing, but a large number of stocks have joined the parade and are making new highs and trending higher with some frequency.
This Market Commentary is an abbreviated version of the commentary featured in The Option Strategist Newsletter.

© 2023 The Option Strategist | McMillan Analysis Corporation