By Lawrence G. McMillan
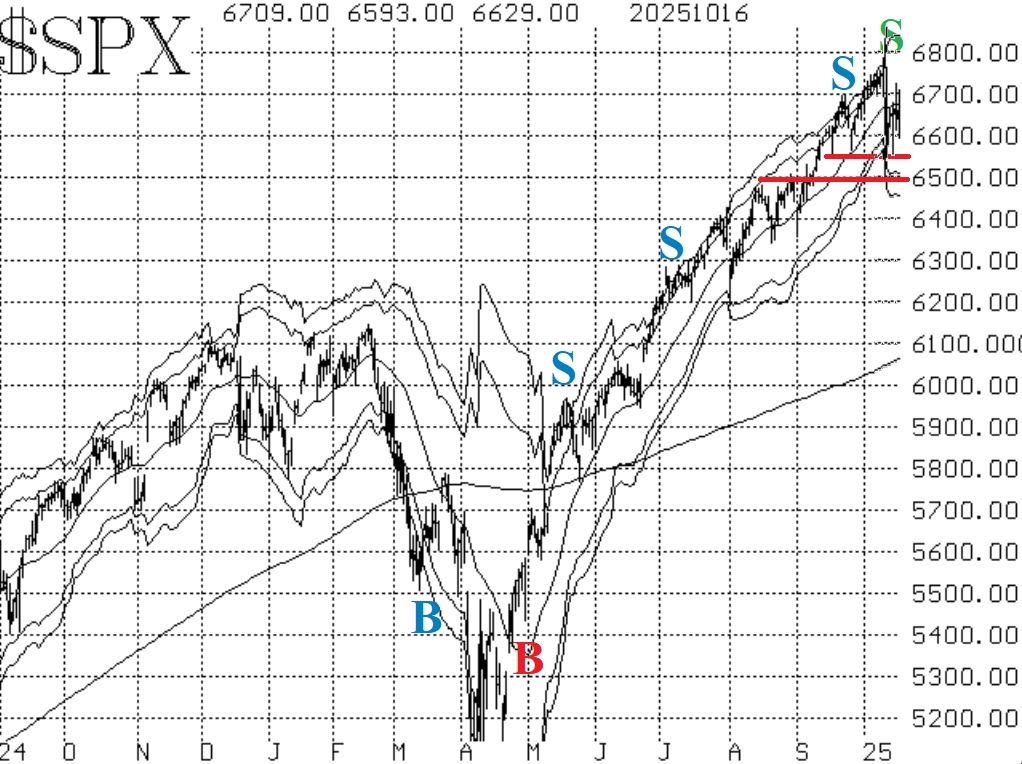
The market has definitely run into some trouble, and this time it might be significant. However, $SPX has held at a well- defined support level several times now, so that gives us a clear demarcation line between bullish and bearish on the chart.
Trouble initially began recently on October 10th, when the new round of China tariffs was threatened. The market threw a "tariff tantrum," and stock prices plunged. The lows that day were near 6500.
Again, this past Tuesday, $SPX sold off hard, but bounced from the 6555 area. Finally, last night S&P futures were down 105 points at one time, but have rallied since. That low was essentially the equivalent for $SPX of about 6525.
So, the 6500-6550 level is now major support for $SPX. If it should fall below there, things could get really nasty. However, if that support continues to hold, then all the angst shown by other indicators of the market will prove to be wrong.
Equity-only put-call ratios have finally begun to rise. The weighted ratio has jumped higher over the past week, and thus has a clear visual sell signal in place. The standard ratio, though, hung on until Thursday, October 16th, before finally confirming a sell signal, too.
Market breadth improved greatly this week. Our breadth oscillators are swinging wildly back and forth, and not giving meaningful signals in the current environment.
Implied volatility is where the greatest change has taken place. $VIX has literally exploded, and when that happens, traders should heed the warning signs. Typically, stocks break down badly within a few days of $VIX and its construct turning bearish.
So, things have changed a lot, and things haven't changed at all. By that I mean that the change in the implied volatility complex is very worrisome and normally precedes a sharp market decline. But things are still the same because $SPX refuses to break down. So, to me, if $SPX is going to remain above 6500, there is no reason to get overly bearish -- no matter what the indicators are saying. This is a classic case of the $SPX chart being the guideline, and it dominates all the other indicators.
This Market Commentary is an abbreviated version of the commentary featured in The Option Strategist Newsletter.

© 2023 The Option Strategist | McMillan Analysis Corporation