By Lawrence G. McMillan
The stock market has continued to decline rather sharply this week. As a result, the support at 1370 was broken -- yet another major support level giving way. The next major support level is likely to be 1330, which is the lows of last July (see Figure 1).
The equity-only put-call ratios are moving to the higher levels of their charts now (Figures 2 and 3), and in a sense, that is oversold. However, they are clearly still on sell signals since they are trending higher.
By Lawrence G. McMillan
The bears have finally managed to take control of the stock market, mostly due to some worries about upcoming economic and regulatory issues. However, the market has quickly gotten oversold, so a bounce may be forthcoming in the near future.
By Lawrence G. McMillan
Put-call ratios are useful, sentiment-based, indicators. The put-call ratio is simply the volume of all puts that traded on a given day divided by the volume of calls that traded on that day. The ratio can be calculated for an individual stock, index, or futures underlying contract, or can be aggregated – for example, we often refer to the equity-only put-call ratio, which is the sum of all equity put options divided by all equity call options on any given day.
By Lawrence G. McMillan
We keep track of “90% days” with a great deal of accuracy. A “90% up day” is, in its purest form, a day when advancing issues outnumber declining issues by at least a 9-to-1 ratio and advancing volume outnumbers declining volume by at least a 9-to-1 ratio.
By Lawrence G. McMillan
The stock market, as measured by the Standard and Poors 500 Index ($SPX) continues to break down through important support levels. It is the close below 1395 that matters. This should activate targets as low as 1330, although it probably won't be in a straight line, for $SPX worked back and forth between 1330 and 1370 in July, and that range should provide some support.
By Lawrence G. McMillan
Stocks are trying to make sense of the election results, the newly bad news out of Europe, and the potentially foreboding “fiscal cliff.” This resulted in some very volatile action in the market Wednesday — especially if one also includes the overnight session in the S&P futures last night.
By Lawrence G. McMillan
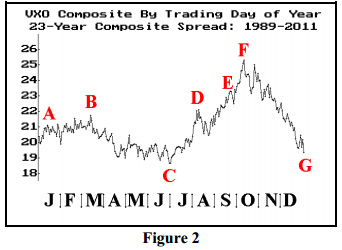
We occasionally publish charts showing the seasonal pattern of $VIX. Figure 2 below shows the composite price of $VIX for a 23-year history (1989 through 2011). This chart is constructed simply by following this method: gather the 23 $VIX prices for the first trading day of the year, sum them, divide by 23, and that is the first point to plot on the left of the graph. Continue that way throughout the year.

By Lawrence G. McMillan
MORRISTOWN, N.J. (MarketWatch) — Ever since the stock market, as measured by the Standard & Poor’s 500 Index SPX broke down through support late last month (on Oct. 23), the bulls have been struggling to regain control.
By Lawrence G. McMillan
Ever since the stock market, as measured by the Standard & Poors 500 Index ($SPX) broke down through support late last month (on October 23rd), the bulls have been struggling to regain control. They have not done so -- yet. However, yesterday's rally has brought $SPX right back up to the 1430 level, and we are still in the October bullish seasonal period for one more day.
By Lawrence G. McMillan
The stock market — as measured by the Standard & Poors 500 Index SPX +1.04% — is struggling to stabilize after last week’s breakdown below support. The onset of the massive storm Sandy on the east coast of the U.S. has not helped matters.
While the end of the month of October is usually a bullish seasonal period, trading on two of those three days was lost to the storm. Moreover, the third day — today — saw subdued activity as not all market participants were able to, or even wanted to, get to work.