By Lawrence G. McMillan
The market has drifted into a dull, waiting state. Despite what appeared to be upside breakouts last week, there was no follow- through. In the end, it will most likely come down to $SPX price once again. In recent days, $SPX has been bounded roughly by resistance at 1420-1425 and by support at 1395-1400. A breakout in either direction would likely create some momentum.
Equity-only put-call ratios have remained on buy signals.
Market breadth oscillators have deteriorated, but they still remain on buy signals (barely).
By Lawrence G. McMillan
There are various trading strategies -- some short-term, some long-term (even buy and hold). If one decides to use an option to implement a trading strategy, the time horizon of the strategy itself often dictates the general category of option which should be bought -- in-the-money vs. out-of-the-money, near-term vs. long-term, etc. This statement is true whether one is referring to stock, index, or futures options.
By Lawrence G. McMillan
MORRISTOWN, N.J. (MarketWatch) — Bullish and bearish forces are both at work, technically as well as fundamentally. Thus, the market is at a point where it could rise sharply or fall sharply — an inflection point.
These matters should be resolved in the days ahead, although the “noise” emanating from the fiscal-cliff discussions may attempt to distort things.
By Lawrence G. McMillan
With the “fiscal cliff” dominating the news, the media tries to link every market wiggle to what some politician has just said about it. Meanwhile, there are plenty of real market forces that are influencing the stock market, but those seem to only be of interest to participants who aren’t media addicts – i.e., only a few. It is our contention that these “real” factors are what is actually driving the market.
By Lawrence G. McMillan
Now that $SPX has closed above 1410 on a closing basis, that is a bullish upside breakout. There is further overhead resistance at 1430, and then it is possible that the market could try for the yearly highs near 1470.
Equity-only put-call ratios are solidly on buy signals. They turned quickly from uptrends to downtrends, just last week.
Market breadth indicators have swung back and forth with short- term movements. But now they are solidly on buy signals.
By Lawrence G. McMillan
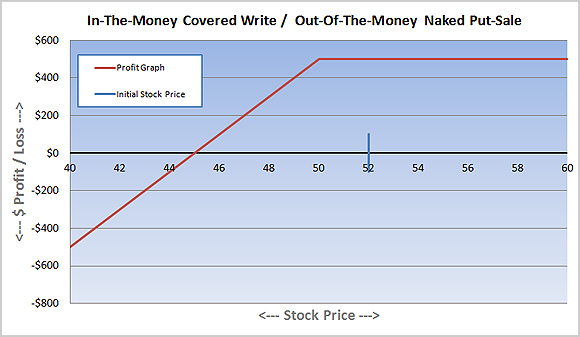
In past issues of The Option Strategist Newsletter, we have stated that we mainly utilize naked put sales rather than covered call writes in its traditional form – even for cash accounts. Several readers have asked not only how this works, but why we do this. So let us explain.

By Lawrence G. McMillan
I was recently asked what guidelines I generally follow in my option trading. This is actually a rather thought-provoking question, especially when it regards something one does almost every day. In our feature articles, many useful general strategies have been given, but not assembled all in one place. After giving the matter some thought, it seemed like it might be beneficial to list some of the "rules" that we follow, either consciously or sub-consciously after all these years.
By Lawrence G. McMillan
MORRISTOWN, N.J. (MarketWatch) — While there are still some mixed signals for stocks, some very powerful signals have lined up so that the bulls once again have a chance to take control of this market.
By Lawrence G. McMillan
The market, as measured by the Standard & Poors 500 Index (SPX) has been in a steady decline since mid-October. There is resistance in the 1395-1410 area, and that must be overcome for the picture to become bullish.
Both equity-only put-call signals have now rolled over to buy signals!
The stock market got quite oversold near the recent lows. Now, Monday's strong oversold rally gave birth to actual buy signals from the breadth oscillators.
By Lawrence G. McMillan
Today's early market action was a continued grind higher as further shorts were forced out of their positions. $SPX made the intraday high just below 1390, the upper end of resistance from 1380-1390. Around 1:00pm EST the Fed Chairman finished up a speech that apparently the market didn't enjoy. This triggered a wave of selling that brought the market down. Despite the sharp midday selloff, we still believe this rally may have some more room to the upside, likely a test of firm resistance in the area of 1400 and slightly above.