
By Lawrence G. McMillan
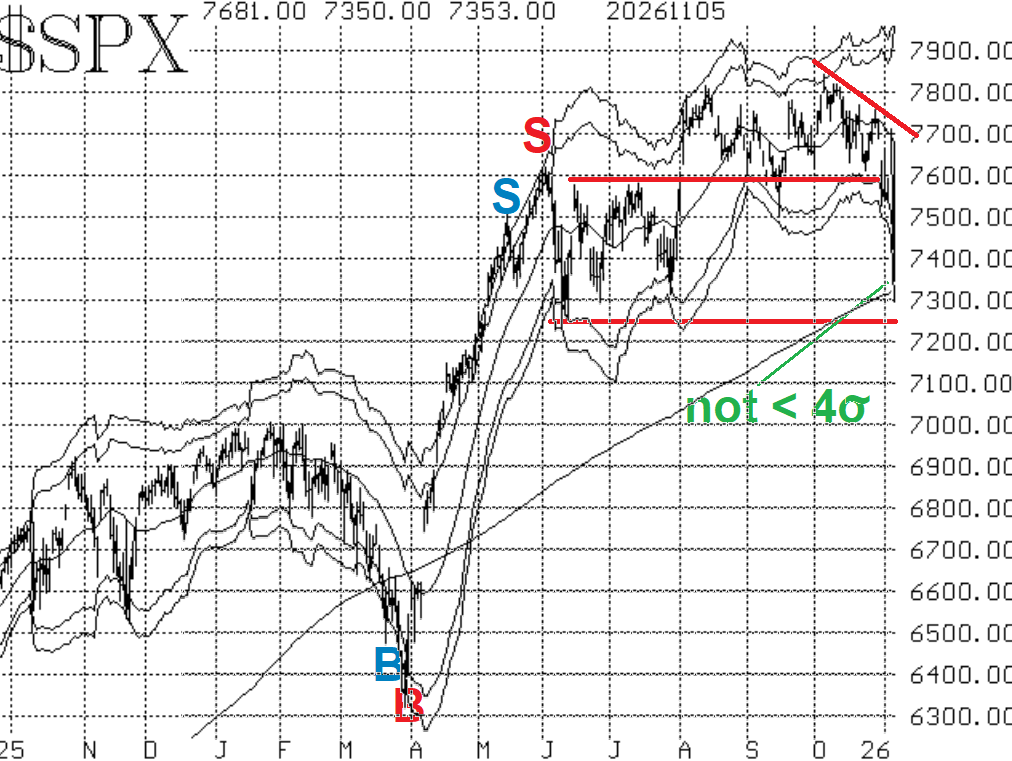
Once the election was over, traders figured the market would be able to finally break out of the trading range -- and it did, although not in the way that many had envisioned. By the time the dust settled, $SPX was down 335 points on November 5th. This was a clear downside breakout from the previous trading range.
The decline reached the rising 200-day Moving Average of $SPX, and a bounce is underway today. This is a return to, and almost complete traverse of, the prior trading range that had existed from May through July of this year. The lower end of that range is 7200-7250. That should be support. Overhead resistance is heavy in the 7550-7600 area now.
Equity-only put call ratios have been rising since their last sell signals (marked with a green "S" on each chart in Figures 2 and 3). Both are at new relative highs and will continue to be a bearish stock market signal until they roll over and begin to trend downward.
Breadth has been more mixed, swinging back and forth, ending with a monster day of declines on November 5th. NYSE breadth has been more positive than "stocks only" breadth. As a result, the NYSE breadth oscillator remains on a buy signal, while the "stocks only" oscillator is on a sell.
This brings us to $VIX and its related indicators. The entire complex has been getting more bearish recently, especially after the big decline on November 5th. If the 20-day MA of $VIX crosses above the 200-day MA, that would be a new trend of $VIX sell signal for stocks. That seems inevitable. Countering that slightly is the fact that a new "spike peak" buy signal may soon set up.
So the bears are in charge now, at least for a while. If $SPX gets back above 7620, then this damage will have been reversed. Meanwhile, a breakdown below 7200 could become an even bigger problem for stocks.
This Market Commentary is an abbreviated version of the commentary featured in The Option Strategist Newsletter.

© 2023 The Option Strategist | McMillan Analysis Corporation