
By Lawrence G. McMillan
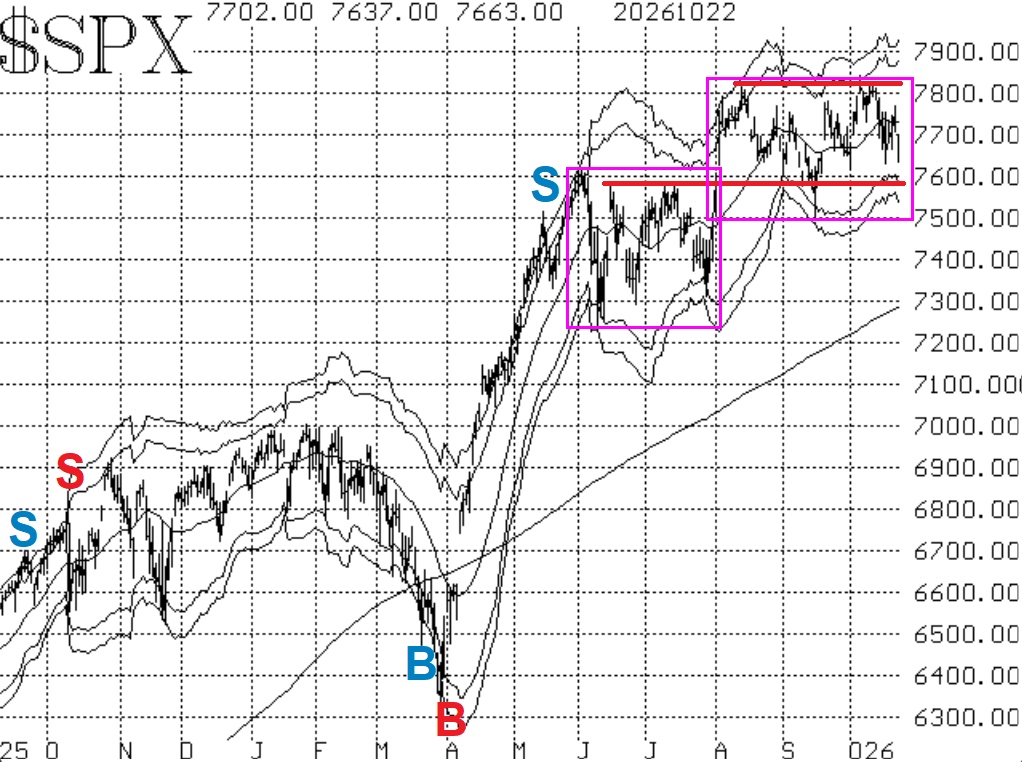
As time drags on, $SPX continues to trade within the trading range that has lasted since late July. This is marked in figure 1 by the box on the upper right. The current box has support at 7580-7620, which has been tested several times and is being tested again today. There is some resistance at 7750-7760 (the highs of several recent trading days), with more substantial resistance at the all-time highs, 7820-7840.
Let's look at the individual indicators. They are still mixed reflecting the trading range environment. Equity-only put-call ratios are both on sell signals.
Countering the negativity of the put-call ratios is an improvement in breadth. Breadth was nicely positive on Tuesday and Wednesday of this week. That was enough to generate a buy signal from the "stocks only" breadth oscillator. It thus joins the buy signal from the NYSE-based breadth oscillator, which has been in place since October 12th.
The indicators based on $VIX itself are still bullish, but perhaps not as strongly as they were in recent weeks. First, the "spike peak" buy signal of October 19th remains in place. Second, the $VIX futures and Cboe Volatility Indices continue to have a positive slope to their term structures.
So, the market continues to have wide disparity between $SPX and the broader classification of stocks. $SPX is still locked in the trading range, and we would not get too excited about individual signals within the range. However, a breakout should definitely be traded.
This Market Commentary is an abbreviated version of the commentary featured in The Option Strategist Newsletter.

© 2023 The Option Strategist | McMillan Analysis Corporation