
By Lawrence G. McMillan
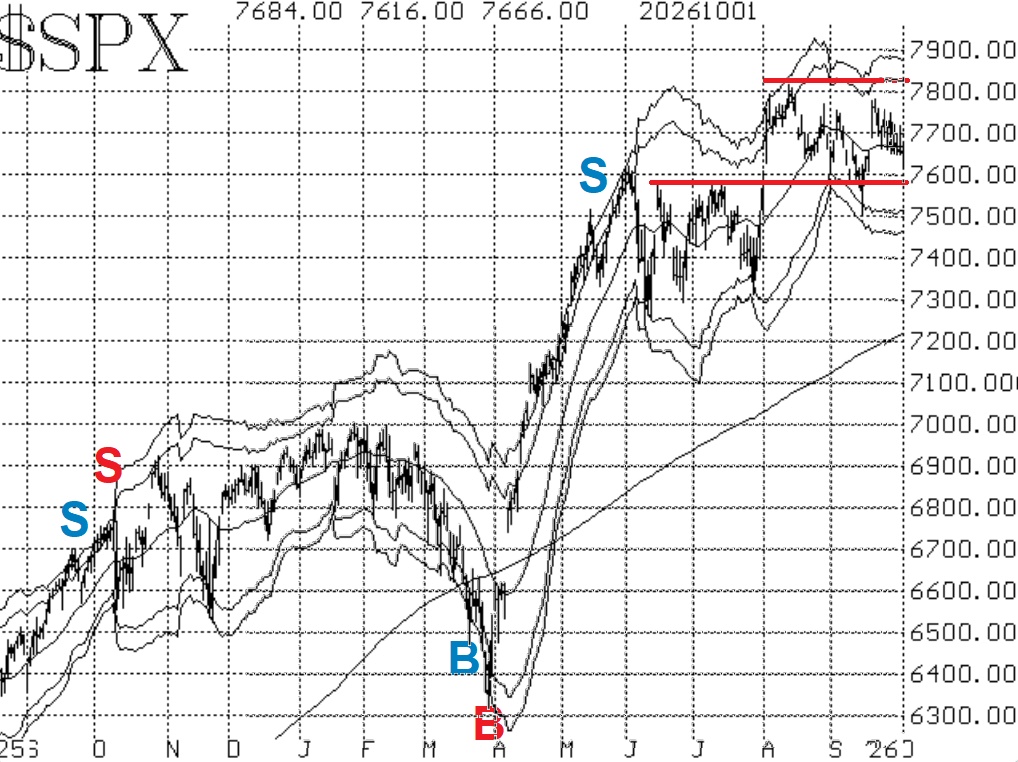
The stock market continues to be range-bound. $SPX is still solidly between support at 7580-7620 and resistance at 7780-7820. Those are the two red horizontal lines on the graph in Figure 1.
Market internals continue to be poor, causing some of them to reach oversold status. Let's start with the equity-only put-call ratios (Figures 2 and 3). They remain split in their signals. The standard ratio is still slowly climbing, thus keeping its sell signal in place. The weighted ratio rolled over and began to decline a little over a week ago, so it is on a buy signal.
Breadth has continued to be poor. Most days have been heavily in the red, while only a few modest green days are sprinkled around. This action has kept the breadth oscillators on sell signals and has pushed them deeply into oversold territory. But "oversold does not mean buy," so we need to wait for these oscillators to generate buy signals before changing course.
Clearly, there hasn't been any improvement in the market internals. Countering that to some extent is the fact that volatility traders have remained relatively bullish on the stock market, and the indicators surrounding $VIX continue to be on buy signals. The two main buy signals from the $VIX chart remain in place.
Our indicators remain split right now, with the $SPX chart neutral-to-bullish, and the $VIX chart positive for stocks, but the market internals negative. We will take new positions only if there are confirmed signals, though. Continue to roll deeply in-the-money options.
This Market Commentary is an abbreviated version of the commentary featured in The Option Strategist Newsletter.

© 2023 The Option Strategist | McMillan Analysis Corporation