By Lawrence G. McMillan
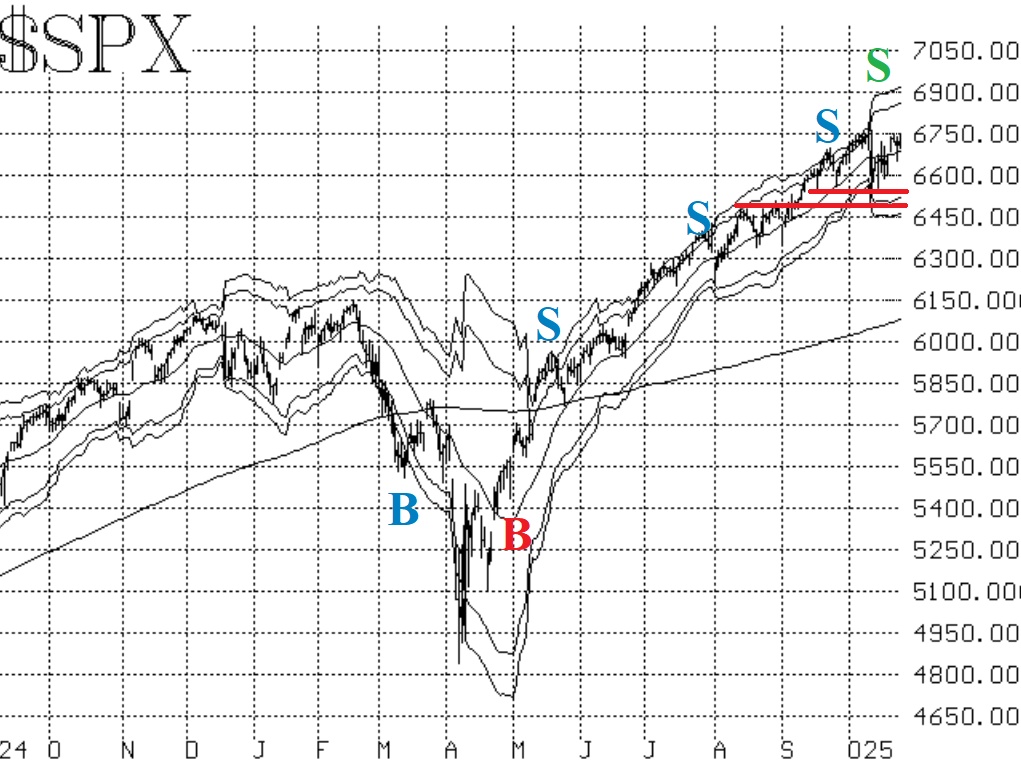
Volatility exploded between October 10th and October 17th, but in the end, it didn't have its usual bearish effect. Rather, $SPX found support in the 6500-6550 area multiple times, and once that held, the effects of higher volatility didn't seem to matter much at all. Now $SPX is making new all-time highs this morning.
This new breakout by $SPX should now have support below it in the 6750 area (the old highs). Of course, the previous support areas will still be in existence as well, but I don't foresee another retest of 6500 in the near future.
The equity-only put-call ratios had rolled upward and generated sell signals as well over the past two or three weeks. These sell signals came from very overbought conditions, and they are still in effect.
On a more positive note, market breadth has been bullish of late. Simple breadth has not been nearly as strong as one might imagine with the broad market making new all-time highs, though.
Implied volatility has been perhaps the most interesting aspect of this recent market. Simply stated, it is usually -- but not always -- a very negative sign for stocks when $VIX and its associated products explodes to the upside. That has proven not to be true for this latest rise in $VIX. In fact, we have a new "spike peak" buy signal as of October 17th, and we have a new trend of $VIX buy signal as of October 21st. These will remain in effect unless $VIX begins to rise again.
In summary, the $SPX chart has once again proven to be the best indicator. It has shown support at 6500 since mid-September, and as long as that support holds, the overall outlook for stocks is positive.
This Market Commentary is an abbreviated version of the commentary featured in The Option Strategist Newsletter.

© 2023 The Option Strategist | McMillan Analysis Corporation