By Lawrence G. McMillan
Stocks made new all-time highs again this past week, but early in the week. Even then, breadth wasn't good. Now $SPX has pulled back slightly from those intraday all-time highs of Tuesday. Yes, there are overbought conditions, but more importantly there is the looming September 30th deadline for a possible government shutdown. The market seems to have been much more nervous about that in the last few days, especially since President Trump said that the government might shut down for a few days.
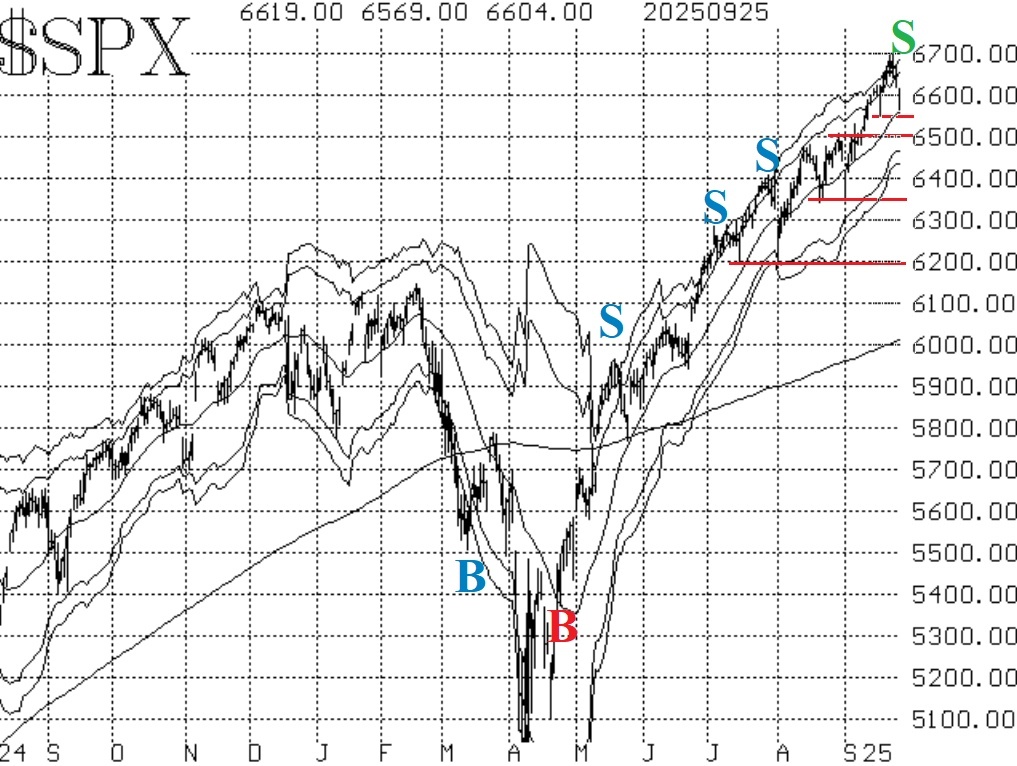
On the surface, the $SPX chart is still very positive, with the Index in an uptrend. The various support levels are marked as horizontal red lines on the $SPX chart in Figure 1. Even though there is support down to 6200, I think the support at 6500 is crucial. That area was tested a few times on the way up in August, and then when the market broke up from there, that was considered an "all- clear" signal by many sidelined investors. If $SPX falls back below there, those same people (plus others) will be inclined to sell.
Equity-only put-call ratios have continued to decline. Traders seemed to be buying plenty of calls after $SPX broke out over 6500 in early September. As long as these ratios are declining, that is bullish for stocks. It is only when they curl over and begin to trend higher that sell signals will come into play here.
Breadth has been terrible, especially on four of the last five trading days. That has pushed the breadth oscillators onto (two-day) confirmed sell signals. This is our shortest-term indicator and is thus subject to whipsaws. However, the fact that breadth has been poor indicates that fewer and fewer stocks are participating in the rally. Eventually, there is usually a price to pay for that.
Implied volatility, in the form of $VIX, continues to remain subdued, and that is bullish for stocks. The trend of $VIX buy signal remains intact, and it will continue to do so unless $VIX closes above its 200-day Moving Average for two consecutive days. A low $VIX is not a sell signal, but merely an overbought condition.
In summary, the $SPX chart remains bullish, and that is the most important thing to note. However, we are beginning to see some sell signals, so we will take positions in line with those as well. Regardless, continue to roll deeply in-the-money options to take partial profits and reduce risk if a price reversal occurs.
This Market Commentary is an abbreviated version of the commentary featured in The Option Strategist Newsletter.

© 2023 The Option Strategist | McMillan Analysis Corporation