By Lawrence G. McMillan
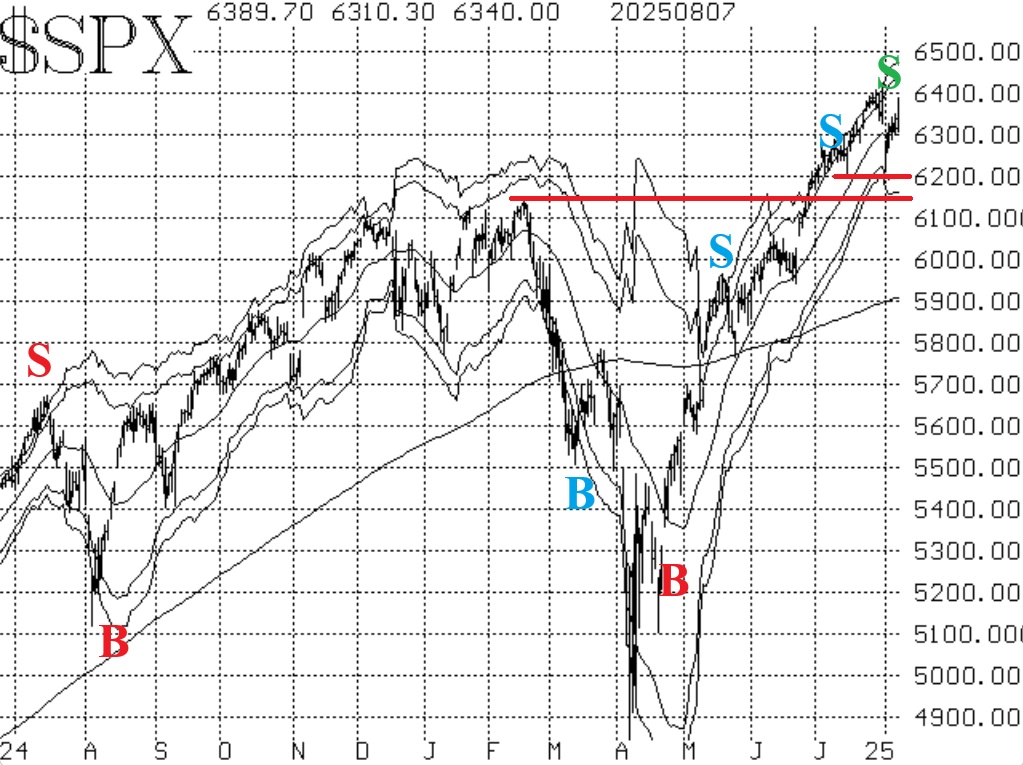
The chart of $SPX remains bullish. The Index pulled back to almost exactly 6200 last Friday, August 1st, and has bounced from there. It also bounced off that level back in early July, so that is now a valid support area. Furthermore, there is support at 6150 -- the old all-time highs as of February. As long as $SPX remains above this 6150-6200 area, its chart is positive and one should maintain a bullish attitude about the stock market. A failure at the 6150 level would likely bring in some heavy selling.
Equity-only put-call ratios continue to rise, and thus they remain on sell signals for stocks. As long as they are increasing, that means the sell signals are intact. They would only relinquish their bearish attitude if they rolled over and began to trend downwards.
Breadth has not really improved all that much. There has only been one really strong breadth day (August 4th). The two oscillators are not in agreement at this time, so this area is giving us a mixed signal currently.
Implied volatility (VIX) has remained benign, and thus this entire set of indicators has remained bullish as contrasted with most of the above indicators, which are or recently had been bearish. There are two current buy signals, using the $VIX chart as a basis.
In summary, we remain bullish, although there are sell signals appearing and some of our long signals have been stopped out. We will trade individual signals as they appear, because the trading systems built around these signals each have their own stops and profit targets. Meanwhile, continue to roll deeply in-the-money options.
This Market Commentary is an abbreviated version of the commentary featured in The Option Strategist Newsletter.

© 2023 The Option Strategist | McMillan Analysis Corporation