By Lawrence G. McMillan
This market just keeps rolling along. It is overbought, but that's probably a good thing rather than a bad thing. As the noted Smith Barney technician, the late Alan Shaw, said "The most bullish thing a market can do is get overbought and stay there." That's what this market is doing.
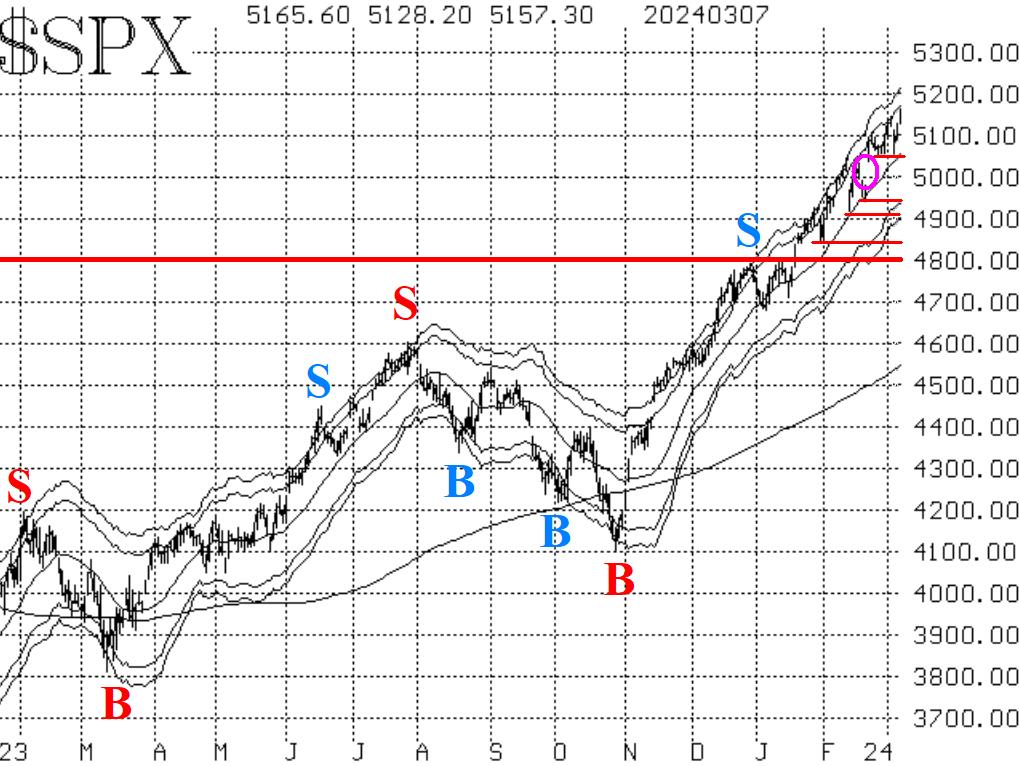
Even though $SPX has continued to make new all-time highs (16 times since the first one on January 19th), it shows no real signs of slowing down. There were some minor days of selling recently, and four times $SPX made an intraday low near 5050, so that is a verified support level now. There are various other support levels below that mostly at the weekly lows when there some one-day selloffs (denoted by horizontal red lines on the chart in Figure 1) and then the major support is at 4800. There is also a gap on the chart, down to 4983 (circled on the chart), and filling that gap would potentially be constructive as well. For one day this week, there was a gap on the upside, but that was quickly filled the next day.
Equity-only put-call ratios continue to hover near the lows of their charts. The standard ratio (Figure 2) made another new relative low this week, while the weighted ratio (Figure 3), fell to the lowest levels since November 2021. Over the past couple of days, the weighted ratio has risen ever so slightly. The computer analysis programs are "saying" that these are on or about to be on sell signals, but that is only because they are so low. But we would not consider these charts to be bearish for stocks until the ratios begin to rise steadily from these lows.
Breadth has been back and forth, but the breadth oscillators have managed to cling to buy signals.
$VIX is languishing back near its lows as well. The "spike peak" buy signal is still in place. Meanwhile, the trend of $VIX remains bullish for stocks because both $VIX and its 20- day Moving Average are below the 200-day Moving Average.
In summary, we are maintaining our "core" bullish position in line with the positive $SPX chart. We will trade other confirmed signals around that. There are no sell signals in place now.
This Market Commentary is an abbreviated version of the commentary featured in The Option Strategist Newsletter.

© 2023 The Option Strategist | McMillan Analysis Corporation