
By Lawrence G. McMillan
Several of our indicators generated sell signals at yesterday’s close – mBB, weighted equity-only put-call ratio, and both breadth oscillators. Stocks had been grinding higher in the morning yesterday, then after the FOMC Meeting, the market sold off, triggering these new sell signals. It appears that the first correction since the brief one in early March could be at hand.
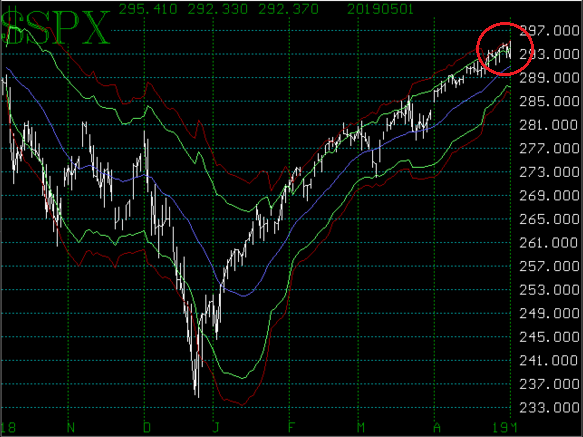
The $SPX chart itself still looks fine. It has not even pulled back to its rising 20-day moving average (currently about 2910), and other trendlines, along with the “modified Bollinger Bands” are still pointing higher. There are various support levels – none of which has been tested very much. The first is at 2910 (last week’s low), then 2890 (the mid-April lows), and 2870 (an early April low). The breakaway gap at 2835-2850 is still on the chart, and that could provide support at well. Finally, the strong support that was tested back in late March – at 2800 – is still in place.
Meanwhile, a “modified Bollinger Band” (mBB) sell signal has finally occurred...
This commentary was excerpted from this morning's edition of The Daily Strategist. Read the full article by subscribing now. Sign up for a free 14-day trial today.

© 2023 The Option Strategist | McMillan Analysis Corporation