By Lawrence G. McMillan
This week, $SPX traded at a new all-time high, just as it did last week. Then, it dropped -- in both cases. Normally, we'd like to see new highs confirmed by strongly positive action immediately following the day that new highs are made. That has not happened, despite mostly positive readings from our internal indicators.
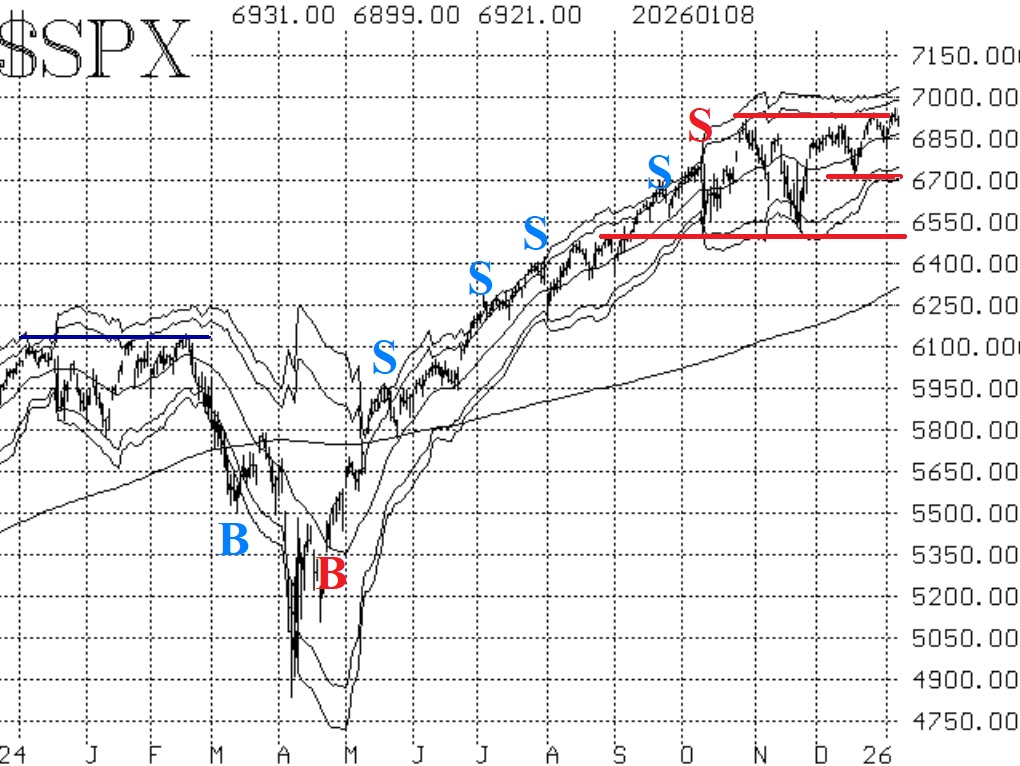
There is support for $SPX at 6824 (last week's lows) and then at 6720 (the December lows). Below there, strong support exists at 6500, but that is so far away that it is not really meaningful at this time. There is no formal resistance for $SPX when it is at or very near all-time highs, so we generally use the +sigma "modified Bollinger Band" (mBB) as a target of sorts. That Band is currently at 7030 and rising.
Equity-only put-call ratios have continued to rise -- especially the weighted ratio -- even though $SPX probed into new all-time high territory. In any case, as long as these ratios are rising that is a sell signal for stocks.
Breadth has improved, though, The "stocks only" breadth oscillator has generated a buy signal, and we are waiting to see if the NYSE-based breadth oscillator can follow suit. It is on the verge of doing so.
Implied volatility ($VIX) and its various "relatives" are all in the bullish camp. $VIX continues to trade near 15, and that is an overbought condition, but it is not a sell signal. The trend of $VIX buy signal for stocks remains in place.
In summary, the indicators are mostly bullish (although not completely so). But the fact that $SPX can't seem to put together some strong positive action after making new all-time highs might be a warning.
Regardless, we will take new signals as they occur and will continue to roll deeply in-the-money options.
This Market Commentary is an abbreviated version of the commentary featured in The Option Strategist Newsletter.

© 2023 The Option Strategist | McMillan Analysis Corporation