By Lawrence G. McMillan
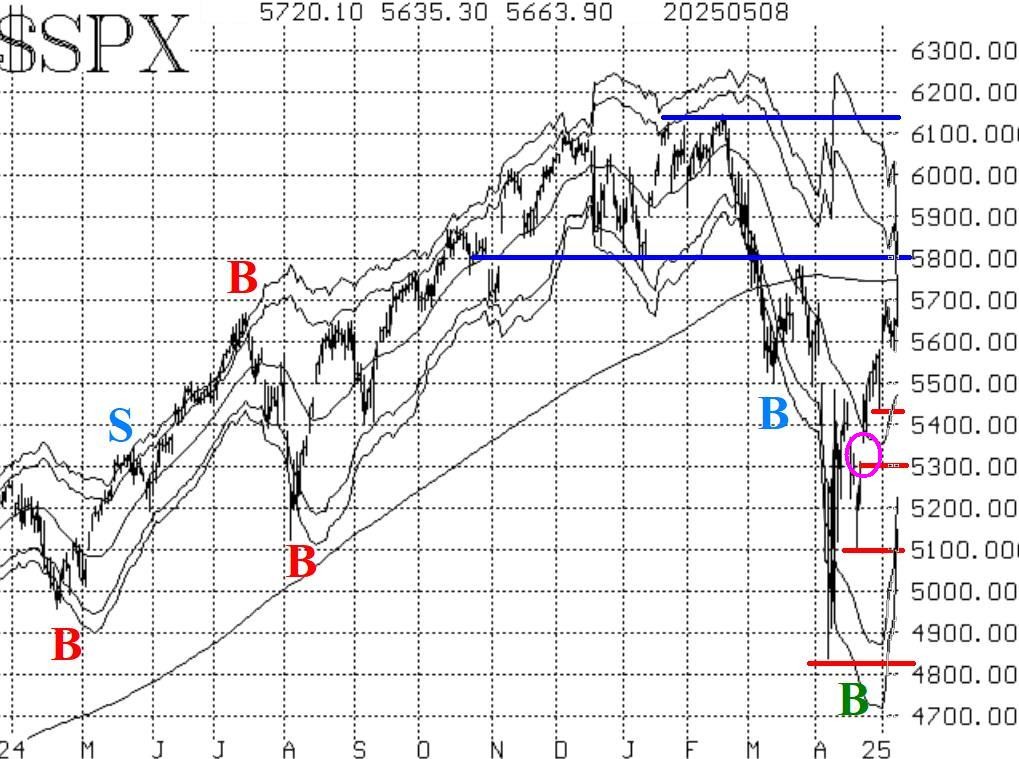
The market rallied early this week, peaking out at about 5700 on $SPX. A modest pullback has taken place since then. There is resistance from there on up to 5800. A close above 5800 would be bullish. Otherwise, the SPX chart remains bearish.
There are multiple support areas on down to the early April lows at 4850-4950. They are marked with horizontal red lines on the $SPX chart in Figure 1. There is one gap left on the chart (circled in Figure 1).
Equity-only put-call ratios continue to drop rapidly, and that means they remain on their buy signals for stocks.
Market breadth continues to be positive enough to keep the breadth oscillators on buy signals. So, as long as these breadth oscillators are in overbought territory that is positive for the overall market.
$VIX has continued to fall as the market has rallied. In any case, the trend of $VIX is still technically upward, by the definition that we use. That will only be reversed if $VIX closes below its 200-day Moving Average.
Separately, the $VIX "spike peak" buy signal of April 9th has come to fruition, and long positions associated with it have been closed.
In summary, we are still maintaining a low-delta "core" bearish position because of the negative nature of the $SPX chart. In addition, we are trading the various confirmed signals around that, and we continue to roll deeply in-the-money options.
This Market Commentary is an abbreviated version of the commentary featured in The Option Strategist Newsletter.

© 2023 The Option Strategist | McMillan Analysis Corporation