
May, 19, 2025
By Lawrence G. McMillanJoin Larry McMillan as he discusses the current state of the stock market on May 19, 2025.

May, 16, 2025
By Lawrence G. McMillanWe have run a couple of articles about the various covered writing ETFs, most of them listed at Yieldmax.com. We reviewed CONY, MSTY, NVDY, and TSLY, which are covered...
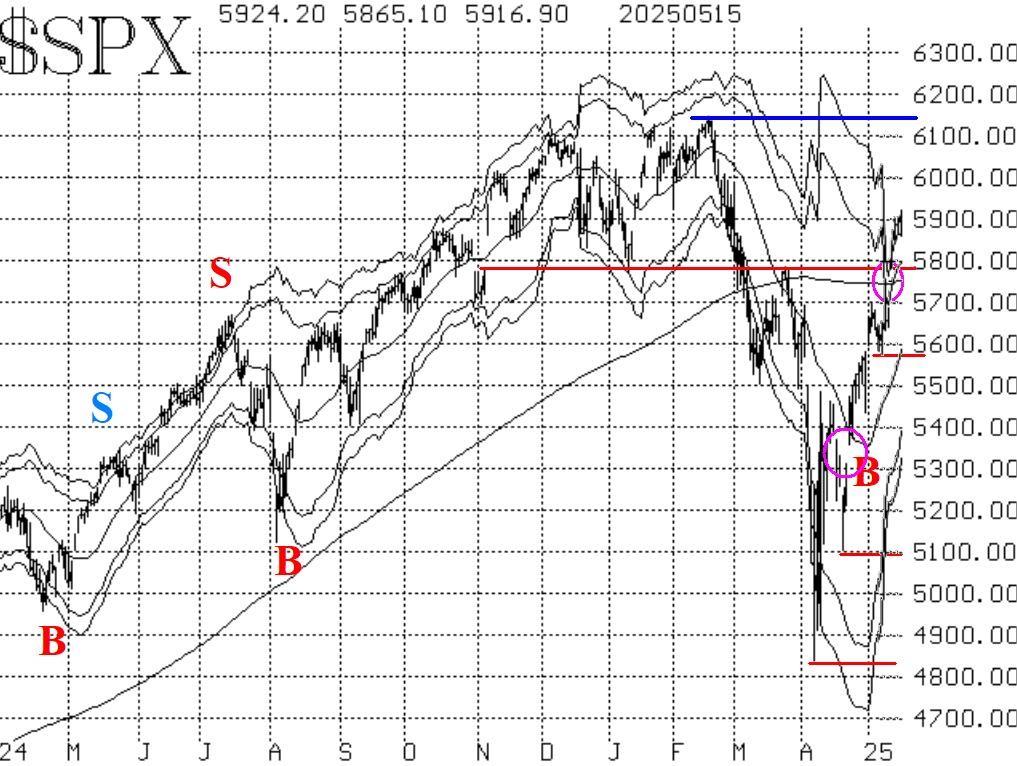
May, 16, 2025
By Lawrence G. McMillanStocks have continued to rally, after last weekend's positive tariff meeting between the U.S. and China. $SPX gapped higher on Monday, blasting right through former resistance...

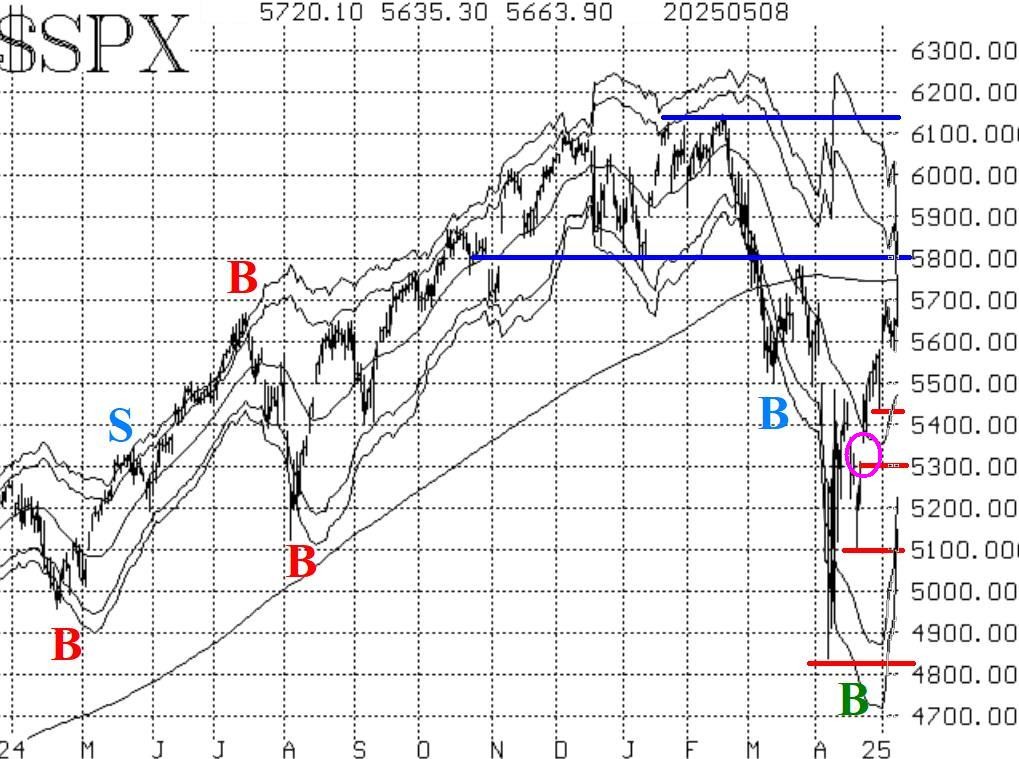
May, 13, 2025
By Lawrence G. McMillanThe market has shown impressive strength recently, with $SPX closing above the key 5800 level. That move alone adds to the bullish tone, but the real question now is: Could...
May, 12, 2025
By Lawrence G. McMillanJoin Larry McMillan as he discusses the current state of the stock market on May 12, 2025.
May, 09, 2025
By Lawrence G. McMillanThe market rallied early this week, peaking out at about 5700 on $SPX. A modest pullback has taken place since then. There is resistance from there on up to 5800. A close above...
May, 06, 2025
By Lawrence G. McMillanJoin Larry McMillan as he discusses the current state of the stock market on May 6, 2025.
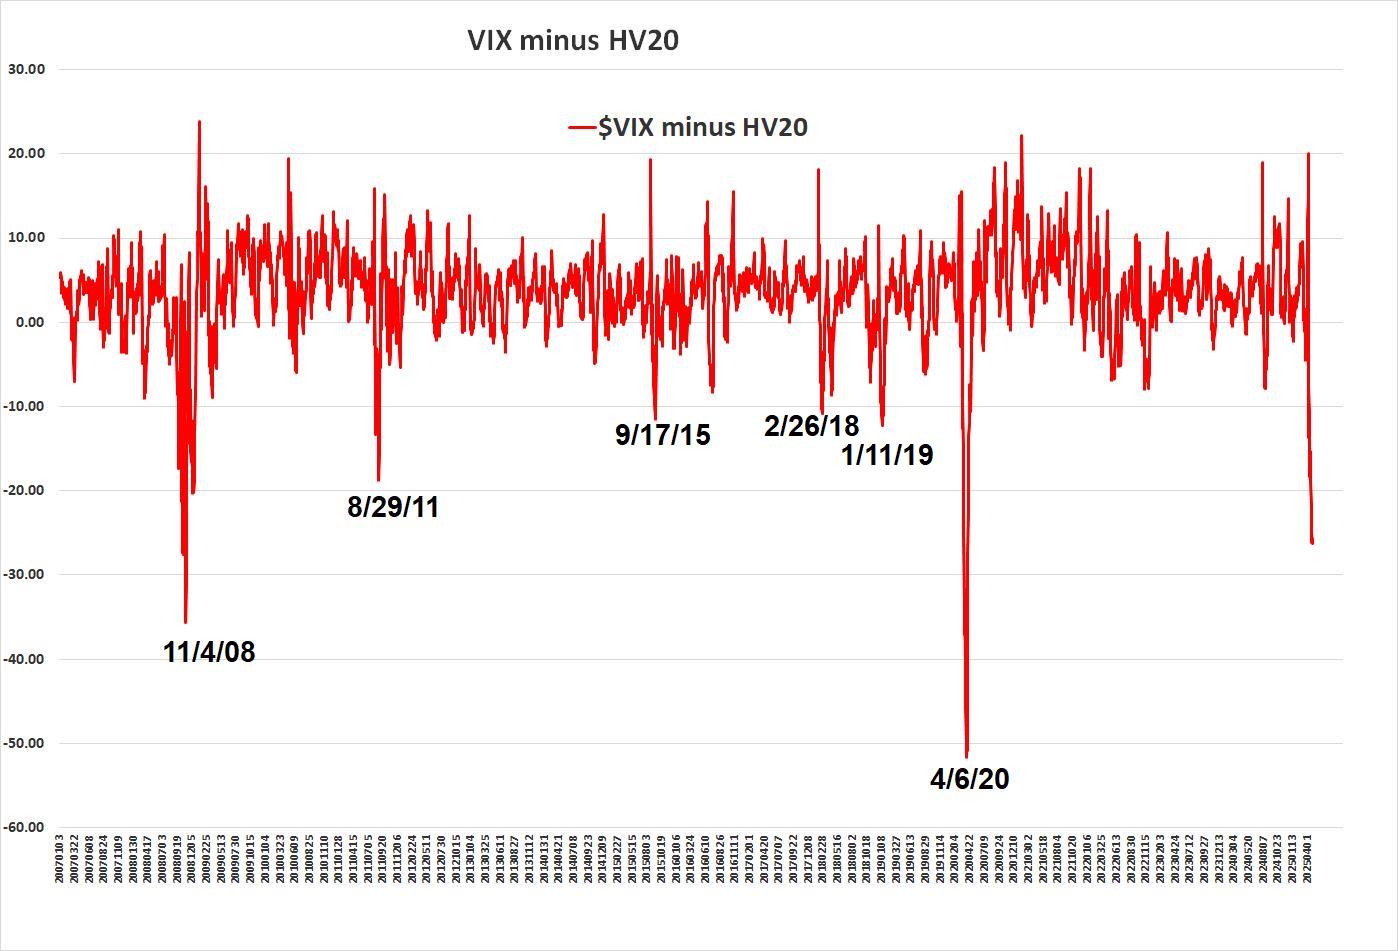
May, 05, 2025
By Lawrence G. McMillanThere has been a good deal of talk in option and other trading circles lately about how high realized volatility is, even though implied volatility has begun to taper off....
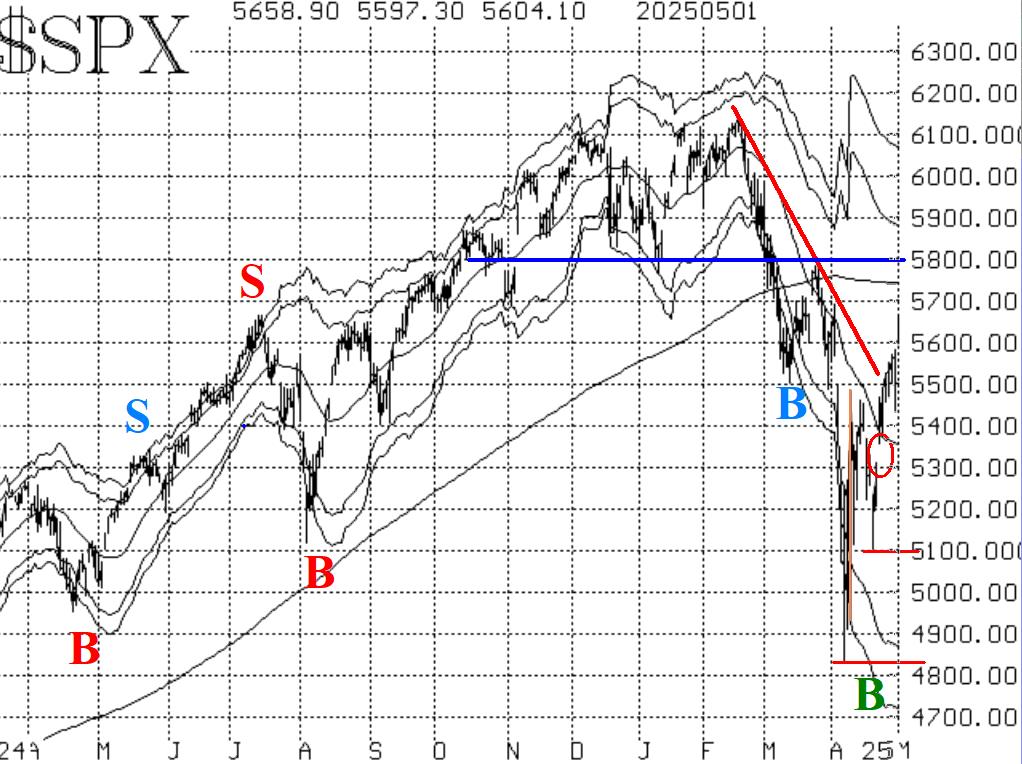
May, 02, 2025
By Lawrence G. McMillan$SPX has risen for eight days in a row and is off to a positive start today, which would make it nine. This type of action has been accompanied by buy signals from breadth,...

Apr, 29, 2025
By Lawrence G. McMillanIn a market environment where volatility is the norm, traders need flexible strategies that adapt to changing conditions. One such strategy is the butterfly spread, a time-...
Pages
© 2023 The Option Strategist | McMillan Analysis Corporation