By Lawrence G. McMillan
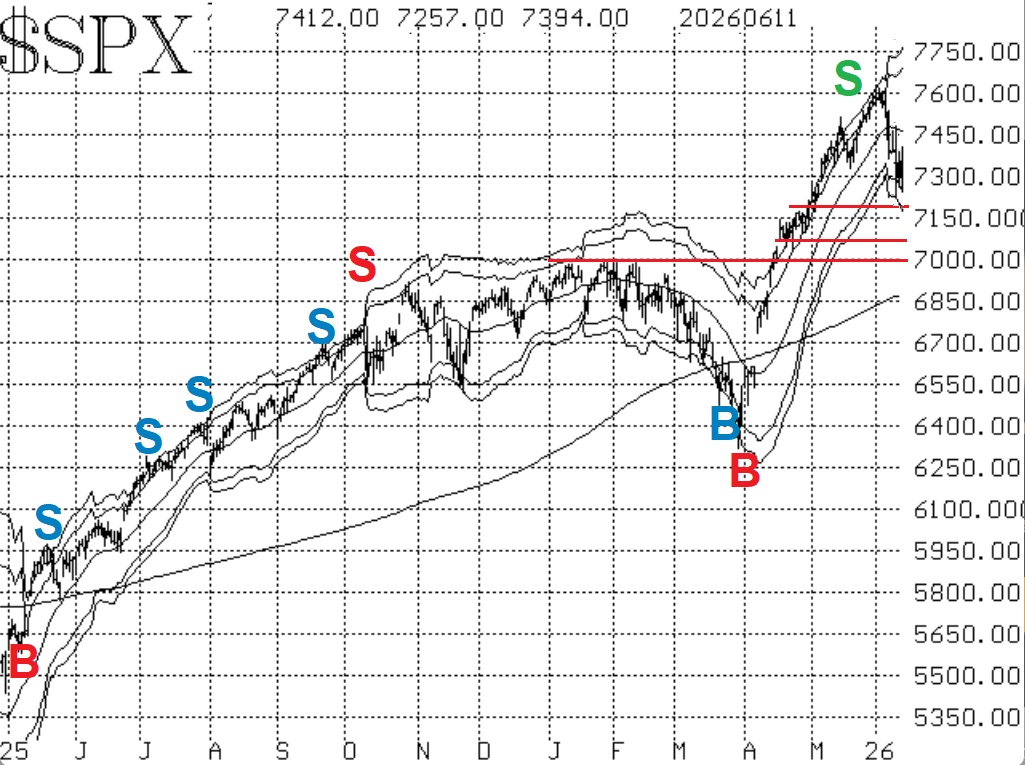
In all, the correction from the early June highs to the lows of this week was about 5%. That was enough to at least temporarily remove the "bullish" designation from the $SPX chart. The Index has now fallen below its 20-day moving average, and there is resistance in the 7500-7520 area. A rise back above that area might be enough to restore the bullish scenario, but for the now the index is in a short-term negative trend.
There is support at this week's lows, 7237. Furthermore, there is a stronger support area in the 7050-7175 range, where $SPX traded in the latter half of April. Finally, there is major support at 7000, which had been resistance all during January and February. A decline below 7000 would be very negative for the chart and for stocks in general.
Equity-only put-call ratios have risen as this volatility has unfolded. The number of puts being purchased is on the rise, and that forces the ratios higher. As long as the ratios are climbing, they are on sell signals for the stock market.
Breadth has been a bit unusual. NYSE breadth has been far superior to "stocks only" breadth all week. As a result, the breadth oscillators are mixed and not giving a clear signal at this time.
$VIX has inflated, but not the $VIX futures. On June 9th, $VIX did spike up to 23.34 and then fell back. That has created a new "spike peak" buy signal for the stock market (green "B" on the chart in Figure 4).
In summary, the $SPX chart is no longer positive, but we do have two new buy signals. Each trading system has its own targets and stops, so these signals can co-exist simultaneously at times. Continue to roll deeply in-the-money options where appropriate.
This Market Commentary is an abbreviated version of the commentary featured in The Option Strategist Newsletter.

© 2023 The Option Strategist | McMillan Analysis Corporation