By Lawrence G. McMillan
For over a week now, strong selloffs have been followed fairly quickly by strong rallies. This is the type of action that occurs in a trading range environment, and we might well be in one of those for a while now.
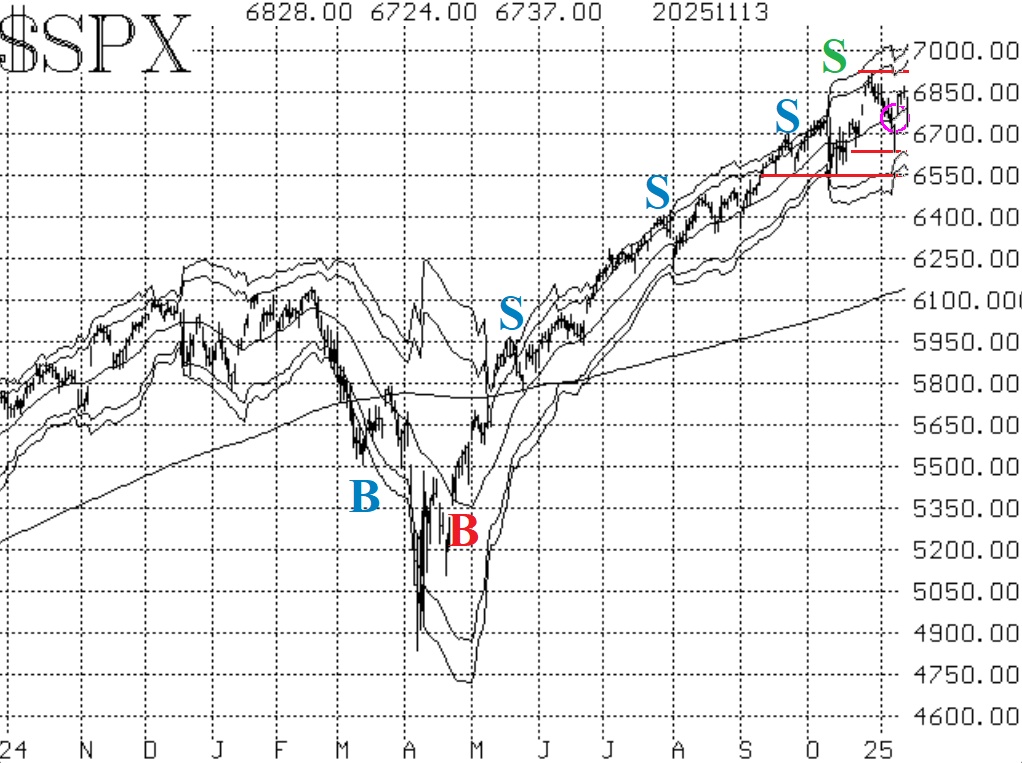
There is resistance at 6900 (the all-time highs). Furthermore, support emerged at 6630 (last Friday's lows) to go along with the stronger support level in the 6500-6550 area. Today's low (so far) was 6646, which would reinforce that general area 6630-6646 as support.
There is a very mixed picture emanating from our various indicators another fact which might suggest a trading range market.
The equity-only put-call ratios are still negative for stocks. That is, the ratios are rising. The standard ratio has made new relative highs on several days this week. The weighted ratio formed a tiny peak a couple of days ago, but that is not significant according to the computer programs that we use to analyze these charts.
Breadth has tried to be positive, but overall it has not been able to accomplish that. Specifically, we were able to get a buy signal from the "stocks only" breadth oscillator this week. It is trying to hold on, but the negative breadth of November 13th and the expected negative breadth of today are going to cancel out that recent buy signal. The NYSE-based breadth oscillator has not given a new buy signal.
Implied volatility ($VIX, etc.) has gotten much more nervous over recent developments, and so some signals are changing here. First, the $VIX "spike peak" buy signal has expired. The trend of $VIX buy signal has remained intact, although that may end as soon as today.
So, we have a lot of signals in flux -- ending, beginning, and setting up. We will trade them as they occur, since each has its own set of stops and targets. Continue to roll deeply in-the-money options when they occur.
This Market Commentary is an abbreviated version of the commentary featured in The Option Strategist Newsletter.

© 2023 The Option Strategist | McMillan Analysis Corporation