By Lawrence G. McMillan
Ever since $SPX dropped over 200 points on Friday, October 10th, (including after-market trading on the NYSE), there has been a difference in the volatility market. Simply stated, the market has been increasingly more volatile. This included not only intraday volatility, but a substantial increase in longer-term volatility measures such as the 20-day historical volatility of $SPX (HV20) or $VIX itself (a 30-day volatility estimate). Over the course of the ensuing week, there were large moves in volatility, including a historic $VIX spike up and back down again. Usually, when volatility begins to increase rapidly, that is a very bad sign for the market, but this time around things seem to be different so far. The purpose of this paper is to see if these movements are random or predictive. We’ll do that by taking a look at some of the things we’ve learned in the past to see if they still apply, or if we have to add “new” outcomes to old indicators.
What Just Happened?
Before getting into the analysis, let’s briefly review what just happened that has the “volatility community” madly writing articles and regurgitating analyses.
Perhaps the first thing that got traders’ attention was the fact that $VIX and $SPX were both up together five days in a row. We addressed that in an article two weeks ago, and showed that it was a basically meaningless event. It had never happened before, but what had happened was that $SPX and $VIX has simultaneously been up three days in a row a few times. That was no discernable pattern to what the market did after those occurrences.
Later, after the market threw another “tariff tantrum” on Friday, October 10th, both realized and implied volatility began to increase sharply. Increasing volatility – especially sharply increasing volatility – is normally bad for stocks.
Another thing that happened:$VIX exploded from 20.64 (close on Oct 15th) to 28.99 (peak on Oct 17th). That has happened before, but what made this event unusual is that by the close of trading on Oct 17th, $VIX was all the way back down to 20.78 and has continued to drop since then. While $VIX was doing its thing, the term structure – especially that of the $VIX futures – responded dramatically as well. The front end of the term structure inverted, and Oct $VIX futures traded more than 2.00 points above the price of Nov $VIX futures. This also resulted in the $VIX futures trading at large discounts to $VIX, in general. Both of those things are usually quite bearish for stocks.
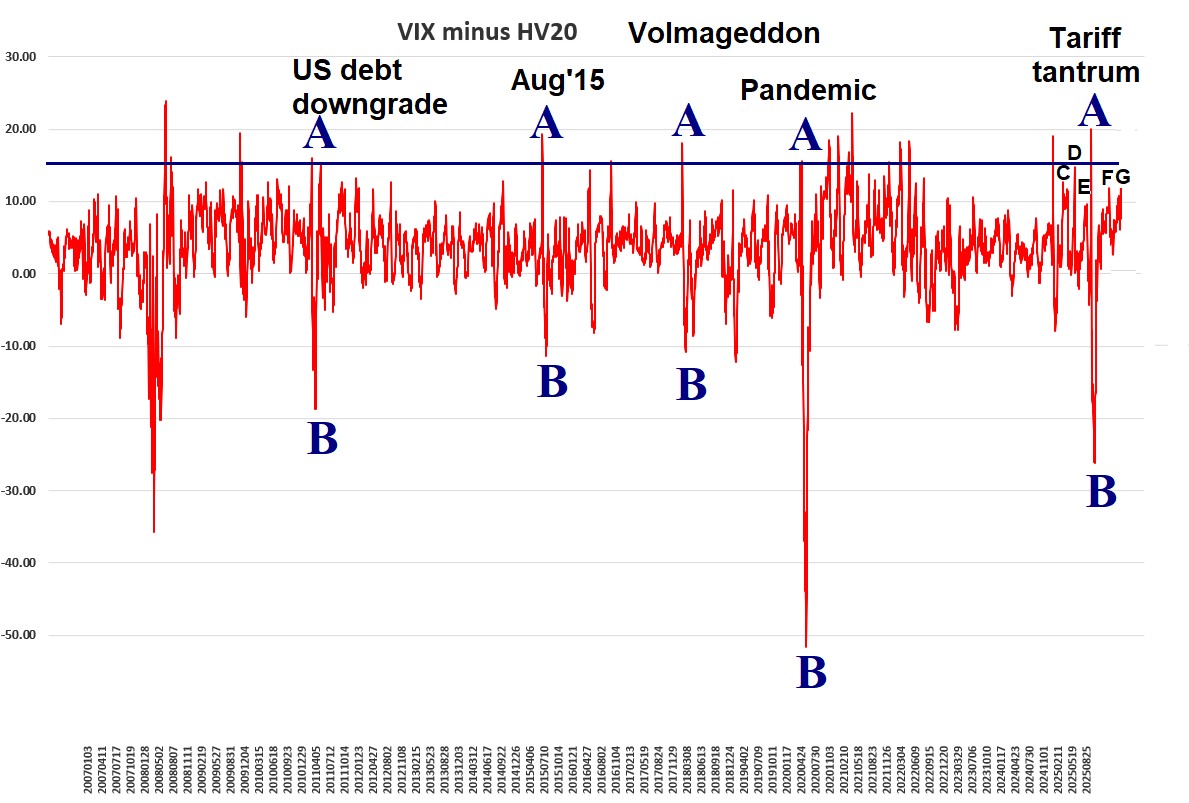
The Differential Between Realized and Implied Volatility
A recent topic that we’ve discussed and based a few trades on is the differential between realized (HV20) and implied volatility ($VIX). First, we published an article back in May describing how the market normally rallies after VIX minus HV20 was –10 (minus 10) or less. That produced a strong buy signal in May...
Read the full article by subscribing to The Option Strategist Newsletter now. Existing subscribers can access the article here.

© 2023 The Option Strategist | McMillan Analysis Corporation