By Lawrence G. McMillan
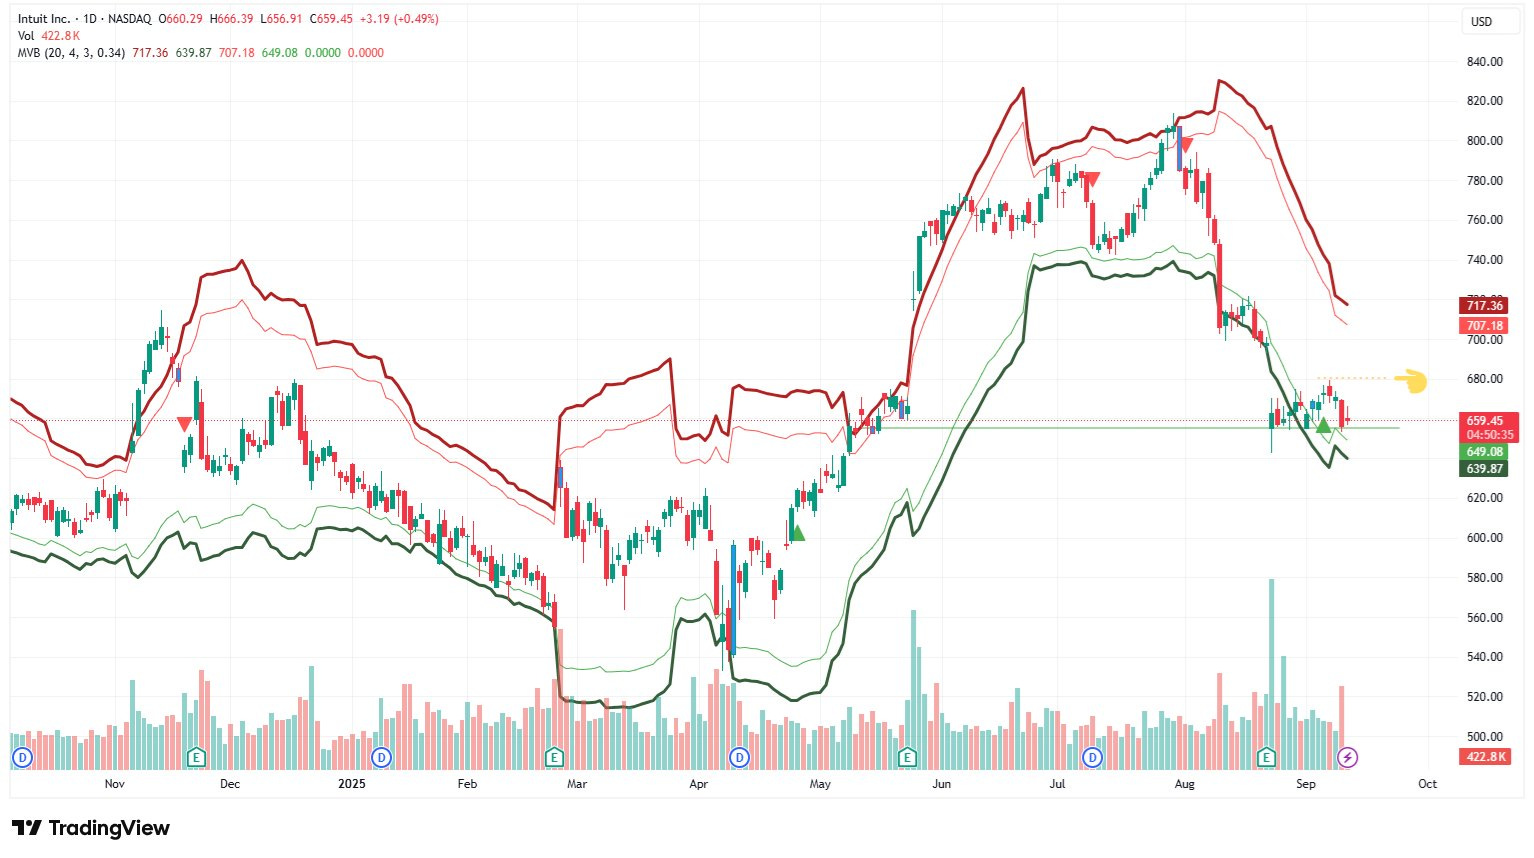
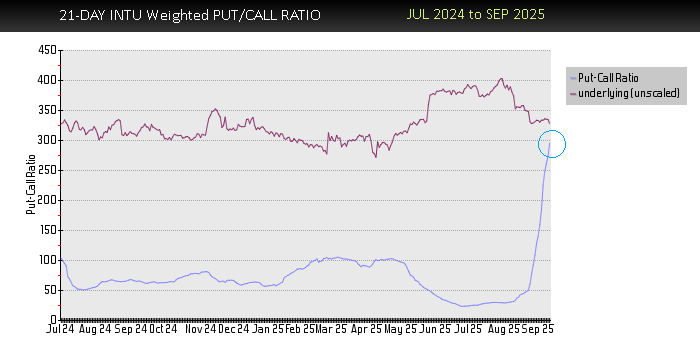
Intuit ($INTU) has been flashing some notable signals recently. A weighted put-call ratio buy signal was issued, although the ratio chart itself has not yet visibly turned over (chart below). In addition, a daily McMillan Volatility Band (MVB) buy signal was generated on September 5th (chart above).
From a technical perspective, $INTU appears to be basing near 655 after its sharp decline following the August 22 earnings release, when investors sold off the stock on weaker-than-expected results and guidance. The stock has since stabilized, with resistance overhead near 680. A close above 680 — combined with visual confirmation from the put-call ratio chart — would represent a constructive development for the bulls.
Trading Implications
For directional traders, two approaches stand out:
- Bullish Breakout Play:
If the stock clears 680 and the weighted put-call ratio confirms visually, buying stock or call options may be a reasonable strategy. - Naked Put Opportunities:
For those who believe support near 655 may or may-not hold, selling naked puts can be a more conservative way to participate.
Naked Put Examples (from today’s scan)
Here are three $INTU setups, ranging from aggressive to conservative, based on expected return and probability of profit:
Aggressive: Sell Sep 632.5 Put @ 2.85
- Probability expires worthless (PrRIE): 82%
- Annualized Expected Return: 18.3%
- Higher return potential, but closer to current support.
Moderate: Sell Sep 630 Put @ 2.45
- Probability expires worthless: 84%
- Annualized Expected Return: 17.5%
- Balanced mix of risk and reward.
Conservative: Sell Sep 605 Put @ 0.55
- Probability expires worthless: 98%
- Annualized Expected Return: 10.2%
- Strong downside protection with lower return.
View today’s Naked Put scan results for INTU here →
The Bottom Line
- Above 680 with confirmation: Stock or calls may make sense.
- If support at 655 doesn't hold: Naked put sales provide attractive risk/reward trade-offs, with flexibility depending on aggressiveness.
You can access Put-Call Ratio signals/charts and our daily Naked Put scans as part of The Strategy Zone. MVB charts and signals can be accessed with a McMillan Volatility Bands Buy/Sell Signals subscription.
© 2023 The Option Strategist | McMillan Analysis Corporation