By Lawrence G. McMillan
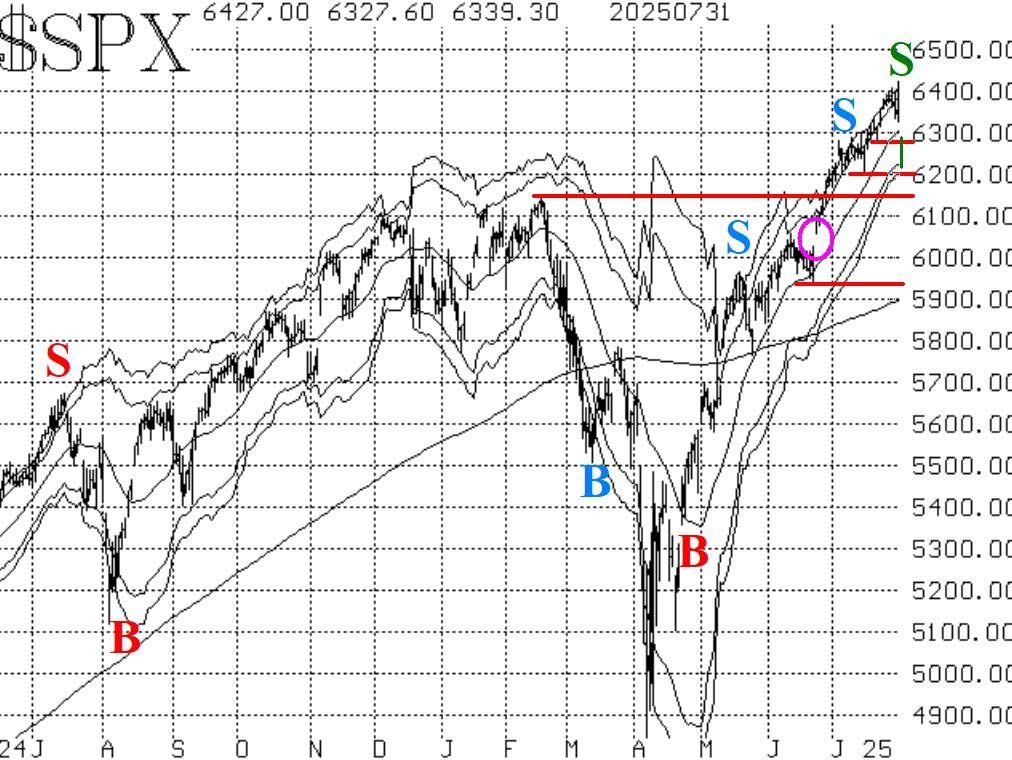
The buildup of overbought conditions has manifested itself in new confirmed sell signals. However, the $SPX chart is still positive, and will remain so, certainly as long as it's above 6150. A bullish case can theoretically be made for $SPX all the way down to 5920, but at this point, if it were to fall back below the February highs (6150), that would be psychologically damaging for it would mean that the whole breakout in June and July was a false one.
Equity-only put-call ratios have confirmed sell signals this week as well. Both ratios began to visibly rise, and that coupled with the fact that the computer analysis programs were grading them as being on sell signals, confirmed their bearish signals for stocks. They will remain on sell signals as long as they continue to rise. These sell signals would be stopped out if the ratios were to fall to new 2025 lows, but that doesn't appear likely in the near term.
Breadth has deteriorated badly in the past six trading days. This was enough to generate confirmed sell signals from both breadth oscillators.
Implied volatility ($VIX) has remained fairly subdued, but it is exploding in the heavy selling today (August 1st). First, the trend of $VIX buy signal is still in place, It began back on June 4th, and is denoted by the lowest "B" on the chart in Figure 4.
The next thing to watch for is $VIX entering "spiking mode." This would occur today on a $VIX close above 18.48.
In summary, we have now seen confirmed sell signals take place in just the last few days However, the $SPX chart is still positive, so we are not taking a net short position in stocks just yet. We will trade individual signals according to the trading systems we have built around each one. Meanwhile, continue to roll deeply in-the-money options.
This Market Commentary is an abbreviated version of the commentary featured in The Option Strategist Newsletter.

© 2023 The Option Strategist | McMillan Analysis Corporation