
By Lawrence G. McMillan
As we stated many times in this week's Stock Market Commentary, there are overbought conditions but no confirmed sell signals (yet). However, we know volatility is low, and we also know that it generally begins to rise in August.
To bolster that last statement, the chart of Composite $VIX is reprinted below. We had written an article about this a few issues ago. The most notable thing is point C on the chart. That is, $VIX typically makes its yearly lows in July and then begins to rise after that.
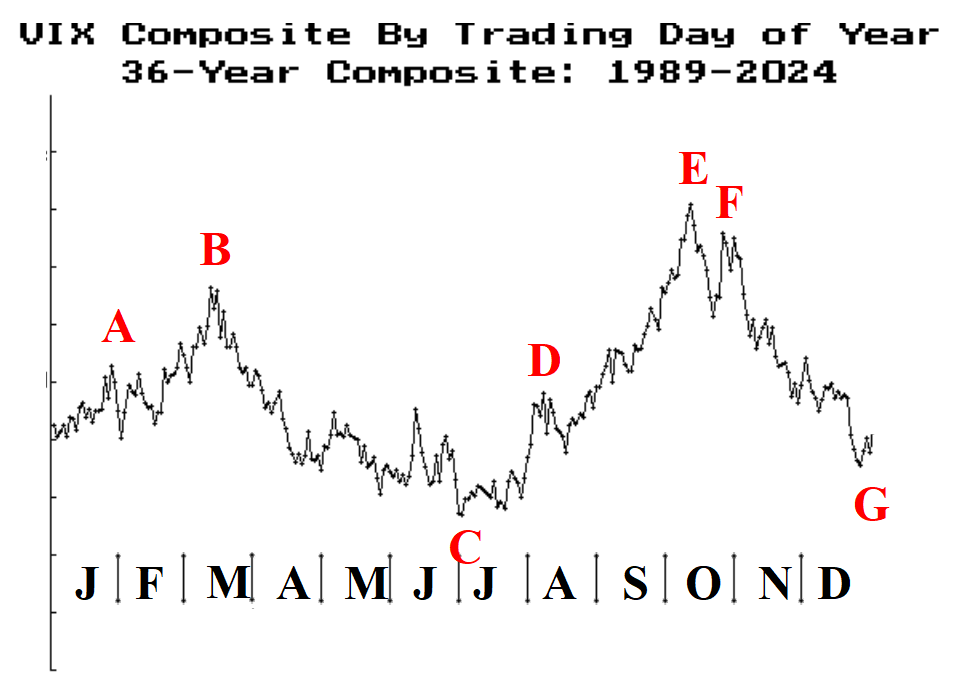
Currently, $VIX is approaching the 2025 lows (see chart at top of page), which were set last January at 14.59. So, for all practical purposes, $VIX is making lows in July, as it normally does.
Even without confirmed broad market sell signals, I believe we can at least analyze this information to see if it makes any sense to “buy volatility” now, based strictly on its seasonal pattern.
The easiest thing to buy is...
Read the full article by subscribing to The Option Strategist Newsletter now. Existing subscribers can access the article here.

© 2023 The Option Strategist | McMillan Analysis Corporation