
By Lawrence G. McMillan
This article was originally published in The Option Strategist Newsletter Volume 8, No. 13 on July 8, 1999.
After having spoken at many conventions and seminars, I would say the most common general question that I am asked is “Should I be a speculator or should I trade hedged positions?” There is no pat answer to that question, for part of the answer depends on the individual’s penchant for what he feels comfortable doing. That aside, it might be enlightening to look at the track records of The Option Strategist hedged portfolio and speculative portfolio as a means of determining at least some of the factors that one would use in making the determination as to whether to be a hedger or a speculator.
First, let’s determine what our definitions of a hedger and a speculator are, so that we can have a reasonable basis for this discussion. A speculator is one who essentially makes money only if he is right on his outlook for the underlying instrument. Moreover, he generally buys calls outright or buys puts outright, eschewing spreads, straddles, etc. However, he may occasionally use a spread – but it’s always a vertical spread (bull or bear spread) that is still a quite risky position. He hopes to make big returns and to do so, he realizes that he must take big risks. If you believe any literature that says you can make big returns as a public customer without taking big risk, your beliefs will eventually be shattered – there is no free lunch, especially on Wall Street (it should be noted that professional traders can make large returns on relatively riskless strategies – arbitrage – but the commission-paying public cannot).
On the other hand, a hedged trader will attempt to take positions that have a higher degree of success, but most likely will not provide as large returns or risk, when compared with speculative purchases. Typically he would use strategies such as straddle buys, naked option strangle sales, intermarket spreads, and so forth.
Since we are in the eighth year of publication of The Option Strategist, and since we’ve always kept the hedged strategy results separate from the speculative strategy results, we are able to identify a fairly long track record for both approaches. This is not to say that our track record is the best possible – others may have surpassed it – but I do think it’s fairly typical of the results that a disciplined option trader might be able to expect. As you can see on page four, over the 8 years our hedged strategies are “averaging” an annual return of about 31% and our speculative recommendations are about 94%. It should be pointed out that the speculative returns are largely influenced by a very, very large profit we made in one trade in Coffee in 1997 – a fact that we address when we discuss the returns in more detail.
The object of this article is not to detail our track record – that will be done in a later issue this year. Rather, it is to give you some insight as to how you might expect your track record to behave if you pursue a similar strategy. Those of you familiar with system trading know that any system that has specific entry and exit criteria can thus be analyzed by a computer, using historical data. Things such as drawdown, percent of winning trades, average win and average loss, etc., can be determined for the system. Thus, a system trader has a decent feel for how his account will behave when he actually trades.
But if you are operating a broader strategy – hedged option trading, say – it is impossible for a computer to back-test it because it is a dynamic approach. If options are cheap, you are a straddle buyer; if they are expensive, you may be a naked option seller. If related markets get “out of line” you will establish intermarket spreads. The only real way to gauge how such an approach behaves is to look at the track record of an account that is conscientiously practicing the method.
Similarly, it is difficult to back-test a dynamic speculative option buying approach – although perhaps not as difficult as back-testing a hedged approach. When you are using more than one component – say, option volume alerts or put-call charts, coupled with some form of technical analysis on the chart of the stock itself – it is difficult to describe to a computer exactly when you would have bought or sold. Again, an observation of long-term track record may prove to be sufficient.
I think the thing that most clearly separates a hedged strategy from a speculative strategy is the consistency of returns. The chart below shows the history of cumulative profits of the hedged positions closed out over the years in The Option Strategist.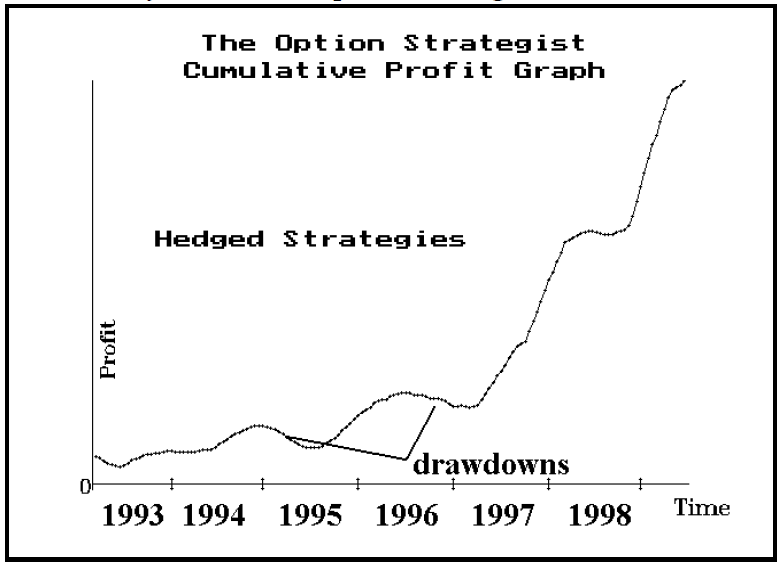
The graph represents the cumulative dollars of profits made over the years. Rather than getting into the details of rates of returns, etc., what I want to convey is the shape of the graph. Yes, there are some drawdowns (if you don’t know what a drawdown is, here’s a quick definition: it’s what happens to your account as soon as you begin trading a system that looked so good on paper). But, overall, the curve moves ahead with some degree of consistency. The last two years have been more profitable than the first few (there is no compounding of profits on this chart). It is not certain what has caused the more recent surge of profits – but it is most likely due to more and better opportunities for volatility trading in the past couple of years.
Now compare that chart with the one below, which represents the same data for speculative positions that we have recommended in The Option Strategist.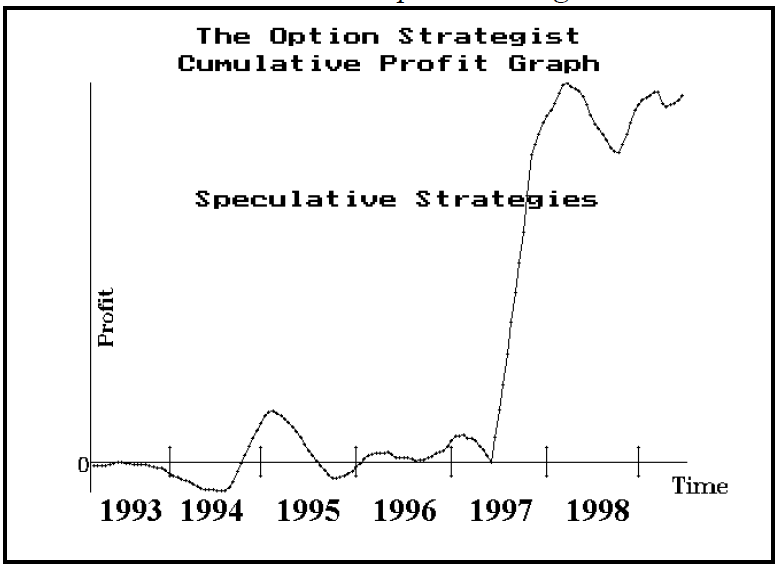
This graph is dominated by the large Coffee profit in 1997, so that trade was eliminated and the graph was re-drawn as shown on the top of page 3.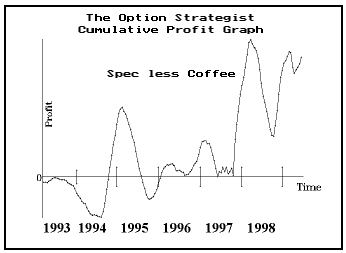
This graph appears to be vastly different from the graph of hedged strategies profits on page 2. First, notice how steep the drawdowns are. While the general trend of the graph is upward, it follows a very herky-jerky pattern – not at all like the relatively smooth pattern of the hedged strategy profits. In fact, eliminating the coffee trade makes the “average” annual return for our speculative recommendations about 33% over the eight-year period. So the hedged and speculative portfolios have about the same returns (without the coffee trade), but you can see that it is a much straighter path with hedged strategies.
So one major conclusion that we can make is that hedged strategies provide a more consistent rate of return, with smaller drawdowns, and therefore are probably less taxing for most traders.
Now you might correctly point out that, if the Coffee trade were included – and it was certainly a real trade that should certainly have been traded by anyone following our speculative recommendations – then the speculative strategy did much better. Yes it did – that’s true. But that still doesn’t remove the fact that speculative returns are much more of a roller coaster.
In fact, when large drawdowns occur, it is only human nature for the trader to perhaps cut back or abandon a strategy altogether. Since large drawdowns are more likely in a speculative strategy, it is therefore more likely that an “average” investor is going to have a much harder time sticking with it until one of the big “scores” is hit. With a hedged approach, drawdowns are more moderate and there is less of a chance of an individual abandoning the strategy right before good profits arise.
Investment
A common complaint by beginning traders is that hedged positions require “too much” margin. Once again, look at page 4 and you will see that the average investment for a hedged position is about $7300 while that for a speculative position is just under $2000. That’s a big difference – especially for a small account. Unfortunately, just that fact alone attracts many small and/or beginning traders to the speculative strategies, whereupon they run into one of those large drawdowns right away and are wiped out.
In any strategy you attempt to trade, you should allow enough money for 1) the initial margin requirement for positions you intend to carry, plus 2) the expected drawdown. A simple example might suffice. Suppose that you have researched a day trading system involving S&P 500 futures and that a review of past trades shows that the system has had a maximum drawdown of $10,000. The day trade margin for one S&P futures contract is $12,000. So you should have at least $22,000 in your account, then, to begin trading this system.
The same sort of analysis should be done with a more complex strategy – such as operating a portfolio of hedged strategies or speculative ones. You would need to allow for the drawdown, plus the margin for the average number of positions that are open at any one time.
The following table shows the drawdown, average investment, and average number of positions that we have used in our strategies over the past eight years.
                        Speculative   Hedged
Drawdown                $17,000      $18,000
Avg. Investment   $1,956        $7,316
Avg # of positions            8            14
Drawdn + Investment     $32,648      $120,424
This points out that we allocate about 80% of our investment dollars to hedged strategies. If you have less capital available to you than the amount shown in the bottom line of the table, you can reduce your requirement by taking every other recommendation or perhaps every third one. Even so, a small account would be forced to allocate a larger percentage to speculative positions – with their concomitant drawdowns and somewhat erratic behavior – than it probably should.
Feeling Comfortable
The figures presented above should give one some second thoughts about pursuing strictly a speculative strategy. Even you have a system for producing more winners from your speculative trading, you are most likely destined to experience the same sort of heavy percentage drawdowns somewhere along the way. For example, at many seminars I have run into traders who told me how much money they had made in America Online (AOL). Yet, the stock subsequently had pullbacks from 175 to 100 and later from 160 to 90. It’s unlikely that these (unsoph-isticated) traders switched from buying calls to buying puts. As a result, their drawdowns were substantial.
In summary, you should always pursue a strategy with which you feel comfortable. Don’t trade one just because I say so, or because another advisor does. Rather, if it feels wrong – causing you sleepless nights or keeps you from doing anything during the day except checking your option prices – then don’t pursue that strategy. Find a less stressful one. But even more than that, you should be aware of the general characteristics of a strategy. If you are only trading speculative positions, you should understand that the large percentage drawdowns will come. How will you handle them? If you trade a hedged strategy, it is less likely that you will hit that “big” winner. Will that fact deter you from operating the strategy as it should be done, or will you try to add more risk?
Finally, no matter which strategy you pursue, be sure that you are capitalized properly – allowing for drawdown possibilities as well as the initial investment required for the positions you want to carry.
This article was originally published in The Option Strategist Newsletter Volume 8, No. 13 on July 8, 1999.

© 2023 The Option Strategist | McMillan Analysis Corporation