
By Lawrence G. McMillan
This article was originally published in The Option Strategist Newsletter Volume 8, No. 17 on September 9, 1999.
As most of our subscribers know, we often use option premium levels as an aid in predicting what might happen to the underlying instrument – whether it be an index, a futures contract, or stock. The way that we normally speak about option premium levels is to refer to the implied volatility of the options. Implied volatility is really an attempt to determine how volatile the underlying will be during the life of the option. As implied volatility increases, so does time value premium – and hence the option price. So that an option with a very high implied volatility will be a very costly option, and it will have a great deal of time value premium.
Today’s option traders reduce the concepts of option pricing to speak of it in terms of volatility. That is, rather than say an option is “overpriced” (which is a somewhat subjective term), it is better to say it is trading with a high implied volatility. Implied volatility levels for a given day can be compared with past levels of implied volatility on the same underlying instrument to give one some feeling as to whether or not the current implied volatility readings are “high” or “low”. Implied volatility levels can be used in several ways to help in determining what strategy should be used or how to trade the underlying.
Spikes In Equity Option Volatility
Often a sharp increase in the price of the options on a particular stock is a warning that someone has strong information about a forthcoming corporate event, such as a takeover or an earnings surprise. This is different from merely saying the options are expensive. Not only are they expensive, but they arrived there very quickly – going from, say, “average” pricing to extremely expensive prices in a matter of a day or two. There are not normally too many of these on any given day. A table of the current ones is included on the last page of each issue of The Option Strategist. Normally, there are between two and four issues in that list. In our daily publication, Daily Volume Alerts, the same list is included daily and it generally has just a few “names” on it as well. In this case, option pricing is a direct indicator – that is, if the calls are expensive, we would expect the stock to be the recipient of some bullish news fairly soon thereafter.
Expensive Options In A Bear Market
The above use of option pricing applies only to stocks, but this one pertains to anything on which there are listed options. The rule of thumb is this: if a market is sharply declining, and the options get very expensive, then one can expect a peak in the options’ implied volatility to coincide with the bottom of the bear market for the underlying instrument.
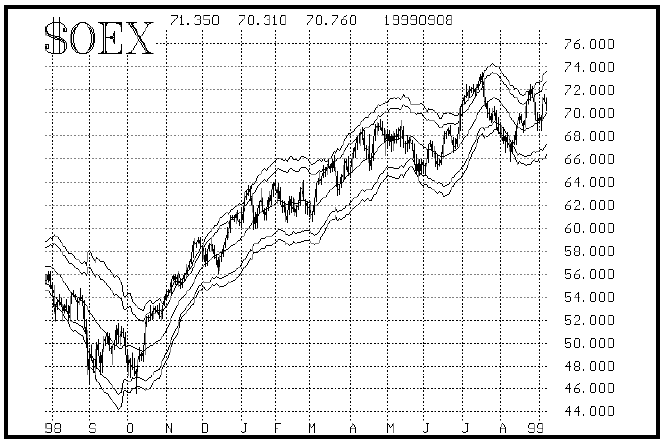
As a noteworthy verification of this statement, look at the charts of $OEX and the CBOE’S Volatility Index ($VIX) in the insert. Note that in September and October of 1998 the market had been declining sharply. At the same time, implied volatility – as measured by $VIX – was increasing rapidly. When implied volatility peaked, the bear market ended (actually there are two peaks on the chart – one at the beginning of September, 1998, and another at the beginning of October, 1998).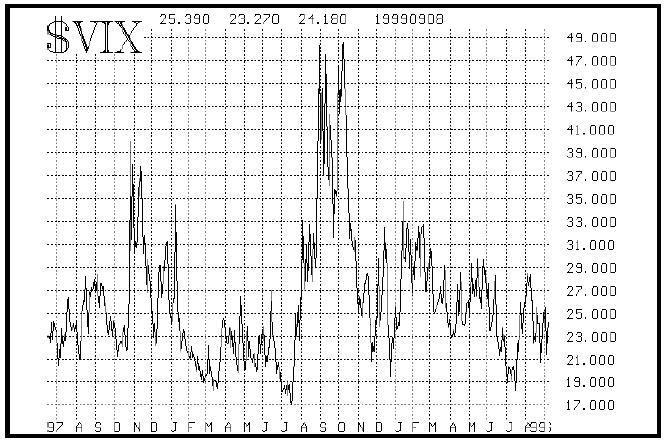
This same phenomenon can be observed in futures. Sugar was a good example recently (chart below). It can be observed in many stocks, too. Just remember that both criteria must be present – the underlying in a rapidly declining bear market and option implied volatility increasing rapidly – before one can use the peak in implied volatility to identify a trading bottom in the underlying. On the October Sugar chart, note that during April of 1999, the bear market was in full force and implied volatility was rising heavily. Then, in late April, implied volatility peaked – signaling that the bottom of the bear market had been reached. This is the clearest signal on the chart, although a “secondary” signal was reached in July 1999, when implied volatility rose fairly quickly during a short-term selloff in Sugar futures. That peak, too, marked a bottom of sort, but the first one fits the “classic” definition much better.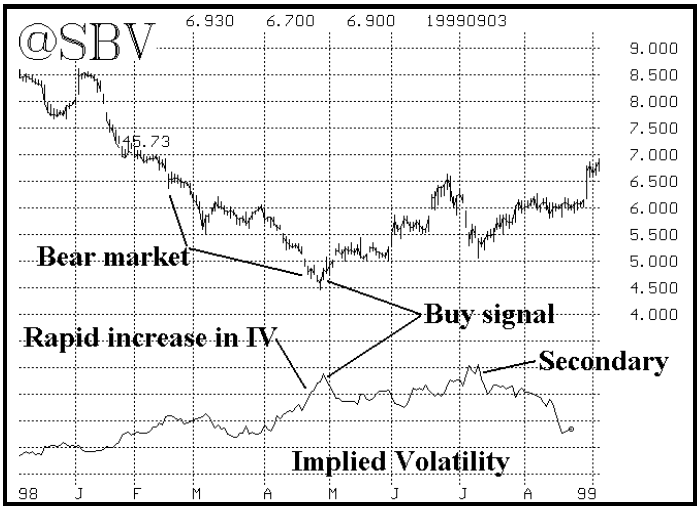
This indicator is a contrary one. That is, when the last bearish trader has bought the last expensive put, the market turns are rallies. Thus, the option activity can be interpreted as a contrary indicator – much as is done with put-call ratios when discussing option volume instead of option prices.
Cheap Options At Any Time
Another use that we have for implied volatility is to identify when it is too low. When that happens, one can expect the market to explode shortly thereafter – although one cannot be certain which direction the explosion will take. Thus, when one identifies these “cheap” options, straddles should be bought. This is the basis for the straddles that we buy almost every issue of this newsletter, in the section entitled “volatility trading” (page 7 this week).
This, too is a contrary indicator of sorts. The public – or whoever is setting the option pricing levels – is complacent when implied volatility gets too low. Option buyers are not aggressive, and option sellers may be quite aggressive. Thus, option traders are not expecting much movement from the underlying. It’s a contrary indicator because what really happens is that the underlying often makes a big explosive move – rewarding the (contrary) option buyers and punishing option sellers.
Event-Driven Straddle Buying
The last way that we use option prices to predict the underlying’s potential movements involves identifying a stock with extremely expensive options as it heads into a major, pre-announced corporate event. These would normally tend to be law suits and hearings before Federal agencies, such as the FDA. Weeks in advance, the company often announces that a hearing will be held. The options then begin to increase in expensiveness until right up to that important date. What typically happens then is that the judge or jury returns its verdict, or the FDA or FTC hands down its decision, and the stock explodes in one direction or the other as the marketplace rushes to factor in the “new” information that it has suddenly obtained.
There is no way to know in advance whether the stock is going to explode up or down because none of the parties involved in the decision-making – judge, jury, FDA, FTC, etc. – “leak” their information in advance. Everyone is on level playing ground here.
A strategy that often works is to buy a straddle on the stock on the exact day before the decision is made public. Admittedly, this is an expensive straddle because option implied volatility will have normally been increasing for several weeks up to that point in time. Nevertheless, the stock usually explodes so violently that it outdistances the price paid for the straddle, and the straddle buyer can make money. This strategy is called event-driven straddle buying. The straddle is sold as soon as the news is announced – usually within a day or two.
A stock that fits this pattern currently, and also did in the past is Liposome Technology (LIPO). The company has announced that its Evacet drug – a treatment for breast cancer – will be reviewed by the FDA on September 16th (next Thursday). Implied volatility has increased tremendously since then – a classic indication by option traders that they expect the market to explode once the FDA makes its decision. But no one knows what the decision will be, so we can’t just buy calls or puts, but we must buy them both – to stand to profit if the eventual stock move is large enough in either direction.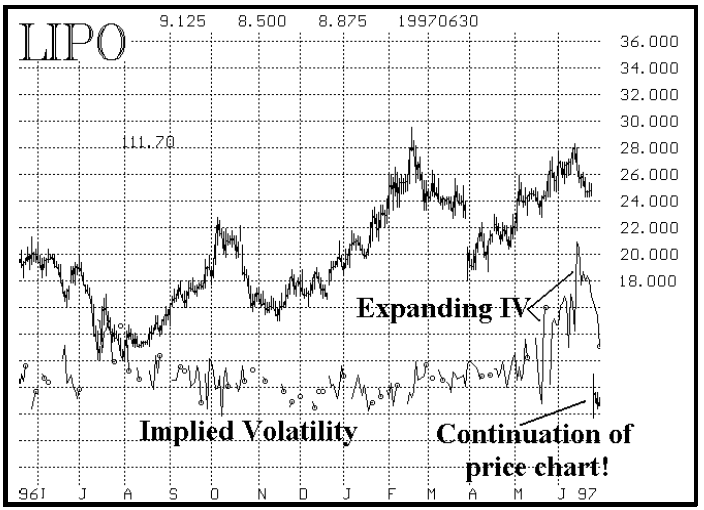
The first chart of LIPO – above – shows the period leading up to an FDA meeting in July of 1997. Implied volatility expanded as that meeting drew nigh, and then the FDA rejected the drug application and the stock collapsed from 25 to 9! The straddle had been selling for about 9 points prior to the news release, so the 16-point drop in the stock price provided nice profits. Note that the stock had mostly been rising before that, so one should be careful to note that the stock price is not a good indicator of what will happen at the FDA meeting. No one knows what the FDA will do, so one cannot possibly discern price clues from the stock itself. All one can do is verify that the options have gotten very expensive, in which case the event-driven straddle buy strategy is called for. Such is the case with Liposome now.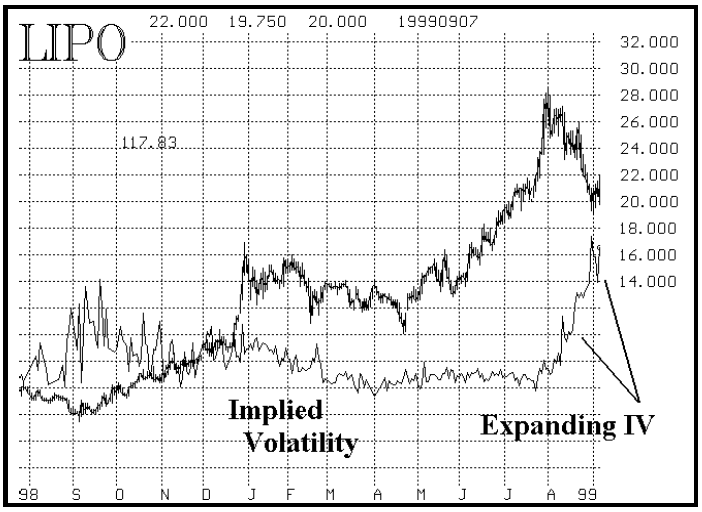
The strategy indicates that one should buy the shortest-term straddle that makes sense. So, since September 16th is the day before expiration, we need to buy the October at-the-money straddle. Sometimes, if the FDA meeting drags on, the stock is halted for a day or two. We would not want to buy September straddles and then discover that expiration arrived before the FDA news was released. It is best to wait until the last possible minute to buy the straddle, for two reasons: 1) this minimizes time decay during the time the straddle is held, and 2) it makes it more certain that one will own the at-the-money straddle when the news is announced; it is not “efficient” to buy the Oct 25 straddle, say, several weeks ahead of time, only to find that the stock is trading at 20 on the day of the FDA meeting. In that case, the straddle would be far too bearish, and not nearly neutral enough.
   Position E168: LIPO Event-Driven Straddle
       On Wednesday, September 15th,
   buy 4 LIPO at-the-money Oct calls (LPQJ?)
   and buy 4 at-the-money Oct puts (LPQV?)
LIPO: 19              Oct 20 straddle: 7-3/8
Sell the straddle as soon as the stock re-opens after the
FDA announcement is made, regardless of price.
This article was originally published in The Option Strategist Newsletter Volume 8, No. 17 on September 17, 1999.

© 2023 The Option Strategist | McMillan Analysis Corporation