
By Lawrence G. McMillan
This article was originally published in The Option Strategist Newsletter Volume 11, No. 4 on February 28, 2002.
Covered call writing is not a particularly “sexy” topic – in fact, it’s a strategy that I don’t espouse nearly as often as it is practiced. However, it does have its uses – particularly for specific types of accounts. So, in this article, we’re going to take a fresh look at covered call writing – perhaps from a slightly different viewpoint than you’ve thought about it before. The types of statistics that are covered in this article are going to be available in the new subscriber section of our web site, The Strategy Zone.
The “Total Return” Concept
Most covered writers are familiar with this concept, as it has been around for quite a while. It is also the basic thesis of the covered writing approach contained in Options As A Strategic Investment and has been since the book was first published 22 years ago. This concept means that a covered call writer should look at the union of the long stock and the short call, plus all other associated costs – commissions, dividends and margin interest, for example – as one total entity. Thus, the return from the strategy should be based on all of these things. By approaching covered call writing in this manner, one benefits in two ways: 1) it is easier to see why the stock should be allowed to be called away, and 2) it keeps one from concentrating on only highly speculative situations where premiums might be big but so are the risks.
Here is a quick example of the total return calculation, including a $25 commission and a $10 dividend:
  Investment:
    Buy 100 shares of stock at 50:  $5025
    Sell 1 July 55 call at 5:        –475
    Net Investment (total return):  $4550
  Profit if called:
    Sell 100 stock at 55:           $5475
    Dividends received:               +10
    Less net investment             –4550
    Net profit if exercised:        +$935
  Total Return if Exercised:
    Total return = $935/$4550 = 20.55%
    Thus, the total return is all that one is concerned
    with – not the profits and losses on the stock and
    option individually or separately.
You might think that the first benefit mentioned above – it is easier to see why the stock should be allowed to be called away – is a rather strange “benefit.” In reality, the biggest mistake that most covered writers make is that they get “married” to a stock and basically refuse to let it be called away. They try to roll the written calls up and/or out in order to prevent assignment. Often, these rolls are not financially beneficial. These actions result from viewing the covered write as basically a stock ownership strategy in which one is trying to write some calls that expire worthless, so one once again owns his stock free and clear. That is a poor approach to covered writing.
Conversely, the total return approach views the assignment of the written call as the attainment of the maximum possible result. The total return is composed of the call premium, the dividends, and stock price appreciation. One is perfectly willing to let the stock be called away. Only rarely does he roll the option: if a superior return can be attained by staying in this particular stock rather than establishing a covered write in a new stock. Normally, such a roll only occurs if the stock is fairly close to the striking price of the written call as expiration is drawing near.
The second “benefit” mentioned above – it keeps one from concentrating only on highly speculative situations – only makes sense if one uses the total return concept in conjunction with some basic statistical analysis to determine the “probability of success.”
The Probability of Success
In many option strategies, fairly significant statistical measures are employed in order to judge the potential profitability of the situation. For example, in our straddle buying analyses, we use fairly advanced probability theory as well as other statistical measures in order to decide what the chances are of the stock reaching the breakeven point. However, in covered writing, there has traditionally been a reliance mostly on arithmetic and not statistics.
Specifically, the percentage returns and percentage of downside protection are arithmetical calculations that dominate many covered writing analyses. However, neither one takes into account the volatility of the underlying stock. In order to do that, one would need to express returns and protection of the covered write in terms of standard deviations, not percent.
A brief example can illustrate this concept. Commissions and dividends will be ignored in this example, in order to keep things simple.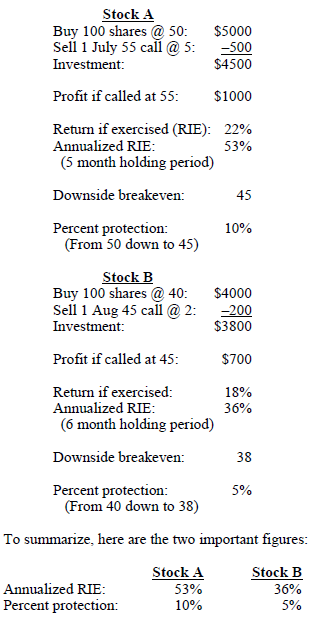
So, Stock A must be the better covered write, right? It has a better return if exercised and offers more downside protection. However, one cannot say which of the two is the better covered write without knowing something about the volatility of the underlying stocks. If Stock A is far more volatile than Stock B, then perhaps the better covered write is offered by Stock B.
Let’s add this information to our example:
                Stock A    Stock B
Volatility          70%        30%
Thus, Stock A might be a tech stock, while Stock B is a big-cap oil company.
Once volatility is introduced into the equation, one can compute more meaningful statistics, such as the Probability of making money (or alternatively stated, what are the chances of the stock dropping below the “downside breakeven” price?). The following table shows the pertinent data:
                           Stock A   Stock B
Initial price:                  50        40
Downside breakeven (DBE):       45        38
Percent downside:              10%        5%
Prob. Closes below DBE:        42%       42%
Prob ever trades below DBE:    80%       80%
The probability numbers are identical! That is, there is an equal chance of making or losing money in either situation. Even though the stocks have different volatilities, the options expire in different months, and the prices of both the stocks and the options are different, with this type of calculation, one can compare the two directly – and they are essentially equal.
In addition to assessing the amount of downside protection, one also needs to look at the profit potential. Rather than looking at the annualized return if exercised, one should do an “expected return” computation, in which the volatility of the stock (and the time remaining) are inherent in the computation.
In an expected return computation, one assumes the stock can move anywhere between plus or minus three standard deviations (a distance dependent on the volatility and the time remaining). In addition, there is a standard formula for the probability of the stock being at any point in that spectrum. One knows the profit or loss of the covered write at each point, so the expected return of the strategy is the sum of the profits at each point times the probability of the stock being there.
                            Stock A   Stock B
Raw expected return             11%        5%
Annualized expected return      26%       10%
So, the more volatile covered write is actually the better one, after all (you probably thought it was going to be the other one, didn’t you?). Both covered writes have an equal chance of making money, but the higher expected returns from Stock A make it the better choice.
The Upside Breakeven Point
Is that a misprint? What upside breakeven point? The covered call writing strategy doesn’t have an upside breakeven point, does it? Well, yes it does – in a manner of speaking. True, there is no point on the upside at which the strategy could move from a profit position to a loss position, or vice versa – and that’s what an upside breakeven point usually signifies.
There is a significant point on the upside, though, in a covered writing strategy, and it’s what I choose to call the “upside breakeven point” for this strategy. It’s the point at which stock ownership and covered call writing are equal. If the stock were to rise above that price, then stock ownership outperforms the covered write. The graph below shows this concept.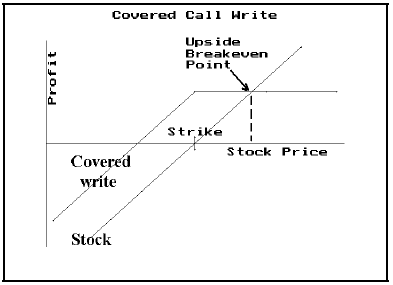
Arithmetically, the upside breakeven point can be stated: Upside Breakeven = Stock Price + Maximum Profit where maximum profit is the maximum profit potential of the covered write in question.
Using the above example, the upside breakeven is:
                       Stock A   Stock B
Stock Price                 50        40
Striking Price              55        45
Call Sale Price              5         2
Maximum Profit              10         7
Upside Breakeven Point      60        47
To verify, consider stock A. If it rises to 60 from 50, a stock holder would have a 10 point gain. So would a covered writer of the July 55 call, because his maximum gain is 10 points anywhere above the striking price of 55 at expiration. Above 60, however, stock ownership outperforms covered call writing in this particular situation. Similar statements can be made about Stock B rising above 47 in comparison to the covered write of its Aug 45 call.
So, that’s the definition of the “upside breakeven point,” but what is its significance when evaluating a covered call writing strategy? Essentially, it is this: if one feels that there is a significant chance of the stock rising above the breakeven point, then he should probably just buy the stock and not bother with a covered call write.
The concept of the covered writer assessing his strategy versus stock ownership is a common one. However, in “conventional” covered writing analysis, the comparison is always with regard to the downside. One compares the risk of owning the stock with the protection (and increased “income” in the form of the call premium) offered by the covered call write. In reality, though, a strategist should also be concerned with this upside breakeven point. He should be concerned that he might be leaving too much on the table if he sells a call against his stock.
Having determined the upside breakeven point, an analyst can then use a probability calculator to determine the chances of the stock rising above the upside breakeven point. For this analysis, one should use the “ever” probability, as afforded by a calculator such as our Probability Calculator 2000. In other words, if one is weighing a stock purchase versus a covered call write, he’d like to know “what are the chances that the stock ever rises above the upside breakeven point at any time during the life of the option?” If this is a significantly large probability, then one should either: a) write a more deeply out of the money call, or 2) forsake the covered write completely and just buy the stock.
Again, using the same two stocks from the examples on page 3, one gets the following results:
                              Stock A   Stock B
Stock Price:                       50        40
Upside Breakeven Price (UBE):      60        47
Volatility:                       70%       30%
Prob. Of Ever Exceeding UBE:      69%       49%
So, there is a 69% chance that Stock A will exceed 60 at some time in the next five months, based on a 70% volatility estimate. For Stock B, there is only a 49% chance that it will exceed 47 in the next six months, based on 30% volatility. Of course, once could use some technical analysis in attempting to assess Stock A’s chances of exceeding 60, as well. But, using only the math, it appears that the Stock A covered write of the July 55 call may perhaps be giving away too much – that the stock may easily exceed 60. One alternative would be to write the July 60 or July 65 call.
The covered writing section of our new Strategy Zone will display the calculations covered here, including the upside breakeven point and the probability of exceeding it. In addition, it will of course show the return if unchanged and return if exercised, both on cash and margin. It will show the downside breakeven point and the probability of falling below it. Finally, the expected return will be shown as well. There will be several lists – sorted by several criteria, so that users can work with the list they prefer (best downside protection, highest expected return, and so forth).
This article was originally published in The Option Strategist Newsletter Volume 11, No. 4 on February 28, 2002.

© 2023 The Option Strategist | McMillan Analysis Corporation