
By Lawrence G. McMillan
This article was originally published in The Option Strategist Newsletter Volume 2, No. 10 on May 27, 1993.
We often refer to the put-call ratio in our Sentiment Indicators section. However, judging by questions we have received from subscribers, it might be beneficial to expand on the concept. We will cover the subject both generally and then specifically, in regard to the way we prefer to interpret the ratio. The put-call ratio is simply the number of puts traded, divided by the number of calls traded. It can be computed daily, weekly, or over any other time period. It can be computed for stock options, index options, or futures options.
  Example: The morning paper shows that the trading activity for OEX
options yesterday was:
    Total OEX call volume: 225,000 contracts
    Total OEX put volume: 245,000 contracts
  Therefore the ratio is 245,000 / 225,000 = 1.09 for yesterday.
Sometimes the ratio is computed using open interest instead of volume. In any case, if the ratio is calculated daily, one usually averages several days' worth of figures to smooth out the fluctuations.
Contrary Indicators
A contrary indicator is one in which the strategist interprets the results contrary to prevailing opinion. For example, if a large number of investment advisory services announce that they are bearish, the market has historically gone up. Thus a contrary indicator can be constructed by monitoring the opinions of investment advisory services, and, when they reach a large majority opinion, doing the opposite. Ostensibly, the reason that this indicator works is that anyone who announces that he is bearish has presumably already done his selling before telling everyone his opinion; therefore, when nearly everyone is bearish it means that nearly everyone has already done his selling. This only leaves buyers, and the market generally rises.
The Put Call
This technical indicator is a contrary one. The contrarian thinks along these lines: if everyone is buying puts, then everyone must be bearish; if everyone is doing something, they can't all be right; therefore the contrarian must assume a bullish stance. So, if the put-call ratio is high, too many traders are buying puts; a contrarian would interpret that as a bullish sign. Conversely, if the put-call ratio is low, too many traders are buying calls; the contrarian would consider that a bearish indicator.
There are several typical put-call ratios that can be computed. Generally, one would not want to mix different types of options. For example, the equity put-call ratio uses the option trading volume of equity options only. The index put-call ratio uses index options only. Each futures contract put-call ratio is generally computed separately: gold, soybeans, currencies, etc. One might also attempt to screen his input a little further: for example, the index put-call ratio should only include index options on U.S. exchanges; the others can be computed separately. Obviously, the more heavily traded option contracts produce a more reliable put-call ratio (equity options and index options being very liquid). Gold futures options by themselves are not that active and may produce distorted results for a period of time.
Traders and investors almost always buy more calls than puts where stock options are concerned. Therefore the equity put-call ratio is normally a number less than 1. If call buying is rampant, the equity put-call ratio may dip to the 0.30 range on a daily basis. Very bearish days may occasionally produce numbers of 1.00 or higher. An average day will generally produce a ratio of around 0.50 or 0.60. Index options, however, produce much larger ratios. Many institutional and other investors are constantly looking to avail themselves of the protective capability of index puts. Therefore, far more index puts are purchased than are equity puts. An average day for the index put-call ratio would produce a reading of about 1.00 -- an equal number of calls and puts being purchased. Bearish readings may approach 1.50 and bullish readings 0.50.
Interpreting the Ratio: There are several philosophies as to how to interpret the ratio once it has been calculated. All philosophies are of the contrarian variety, so the general comments made earlier that high ratios are bullish and low ratios are bearish still hold true. However, quantifying just what is "high" and what is "low" leaves room for interpretation.
One school believes that absolute ratios should be used. An example might be: "if the 10-day moving average of the equity put-call ratio is over 0.65, that is a buy signal". Unfortunately, applying absolute figures to any of the ratios can be counterproductive at times. If the market is in the grip of a prolonged bearish move, more and more puts will continue to be purchased, sending the ratio quite high before it can reverse and start coming back to normal levels. Therefore it is better to look for the ratios to make a relative high or a low before calling a buy or sell signal. This is a more dynamic interpretation; it allows for buy and sell signals to come at different absolute levels of the put-call ratio.
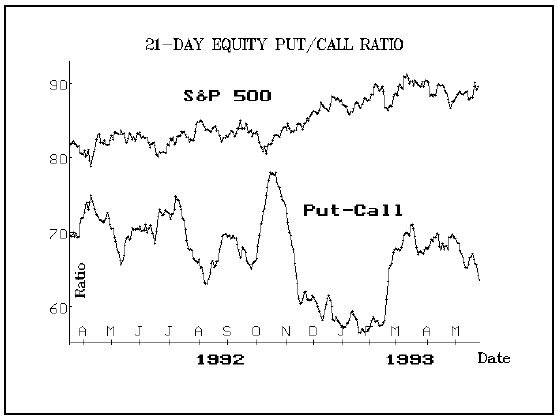
The chart on the top of the next page shows the equity put-call ratio, with the S&P 500 superimposed above it. This graph covers just over one year of time, back to March of 1992. One can see that at certain times, the putcall ratio reached extreme heights before finally generating a buy signal. Note that the peaks in 1992 (there are three of them) all were fairly good buy signals, but each of them came well above the 70 level. Attempting to declare a buy on the market at a lower absolute level would have been an error because the entry point came too early. Similar observations can be made for sell signals after the ratio has reached low levels: don't anticipate -- wait for the ratio to bottom out and turn up before declaring a sell signal. Notice that the two sell signals of May 1992 and August 1992 came with the ratio in the 60–65 area. However, the sell signal of February 1993 didn't arrive until the ratio had fallen well below 60. Again, using an absolute point as an entry level could have led one to sell right into the teeth of the rally that began last October. Overall, the track record of the equity put-call ratio, as evidenced by this chart, is pretty good. The recent buy signal, which came as a result of a long topping process in the 70 area has not been as successful as the buys generated during 1992, but the indicator is certainly worth tracking.
The index put-call ratio for the similar time period is also shown on the next page. It tells a similar story to the equity ratio, although there are certainly differences -- beyond the obvious one that the ratios have different absolute values. Notice that, in the August-October period of 1992, the equity put-call ratio gave a sell and a buy that were not evident from observing the index ratio. The other signals are similar to the equity signals, except that the extremes are not coincident. Notice that the equity ratio rose to its highest point in October of 1992, but the index ratio didn't get very high then at all (although the latter did make a top — and therefore gave a buy signal — at about the same time as the equity ratio did, in October of 1992).
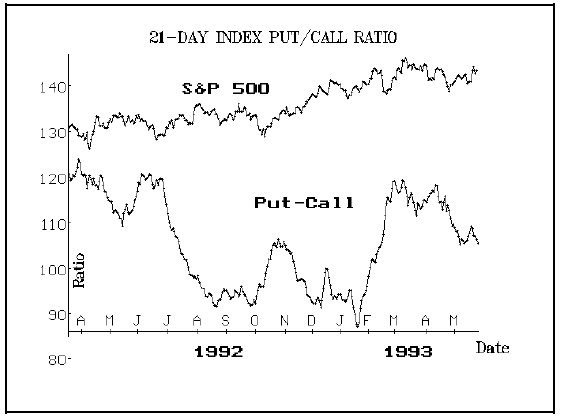
The reason for such discrepancies may be that at times, index put buying is a hedging tactic and is not a speculative strategy that the contrarian can "read". This does not generally happen with equity options. It seems that institutional money managers, who are long stocks, are afraid that they will lose their profits after a quick stock market advance. However, rather than sell their stocks, they buy puts (possibly overpaying for them). Thus they are really bullish (they own stocks), but they are buying puts as a hedge.
This is a difficult situation for the contrarian. What is the institutional manager's true bias? Is he bullish because he still owns stocks or is he bearish because he is buying puts? This is the bane of contrary analysis -- attempting to accurately interpret the data that is being received. The graph shows that the index put-call ratio is less reliable than the equity ratio, but is still helpful in determining market tops and bottoms.
In summary, the put-call ratio is easily calculated. Daily fluctuations can be smoothed out into 10-, 20-, or 50-day moving averages. The ratio should be interpreted bullishly when there is too much put buying and bearishly when there is too much call buying. The phrase "too much" is not easily defined, but looking for local maxima or local minima in the chart pattern is a reasonable way to approach the problem. A buy signal would not be given until the put-call moving average — which is increasing — rolls over and begins declining; a sell signal would be generated when an average which is declining, rolls over and turns up.
This article was originally published in The Option Strategist Newsletter Volume 2, No. 10 on May 27, 1993.

© 2023 The Option Strategist | McMillan Analysis Corporation