
By Lawrence G. McMillan
This article was originally published in The Option Strategist Newsletter Volume 11, No. 23 on December 12, 2002.
As we head into the end of the year, it is time to turn our attention to matters such as the January Effect and other year-end tendencies. In recent years, the January Effect has changed its nature somewhat, but can still be a profitable item to trade. In addition, volatility patterns near year-end have a traditional look to them. We’ll take a look at both in this article, plus a couple of other oft-quoted “January barometers” to see if they really hold water or not.
The January Effect
The January Effect is something that we have traded often and quite profitably over the 11 years that we’ve been publishing The Option Strategist. However, the change in pattern over the past three years may have necessitated a change in strategy.
Historically, the January Effect is defined as the seasonal inclination for small-cap stocks to outperform large-cap stocks. For many years, this effect had occurred during the month of January, so that is where it got its name. The effect usually begins (much) sooner than January these days, but the name has stuck. The rationale behind this effect is that small-cap stocks are beaten down by year-end tax selling. Once that ends, they spring back faster than their big-cap brethren. This is true whether the overall market is going up or down. So, to take advantage of this phenomenon, one would buy the small-caps and sell the big-caps as a spread transaction. Then, when the small caps outperform, the spread should widen regardless of the direction of the broad market averages.
That is the theory. In practice, several refinements need to be made. But since the strategy has a profitable history, it is worth trying to work it into one’s arsenal of seasonal trades. By the way, notice that the proper definition of the January Effect does not say that the market will rise in January – even though some unknowledgeable commentators say so, specifically the one I am hearing on CNBC at this very moment.
There is actually a companion strategy that arises when one studies the January effect. Usually, the smallcaps perform quite poorly during the latter stages of the year, as the tax selling is heaviest in those issues. We have termed this the “pre-January” effect. To capitalize on that trend, one would buy $SPX and sell $VLE – the opposite of the “normal” January effect.
The chart below shows the composite movement of the S&P 500 Index ($SPX) versus the Value Line Index ($VLE) since 1989.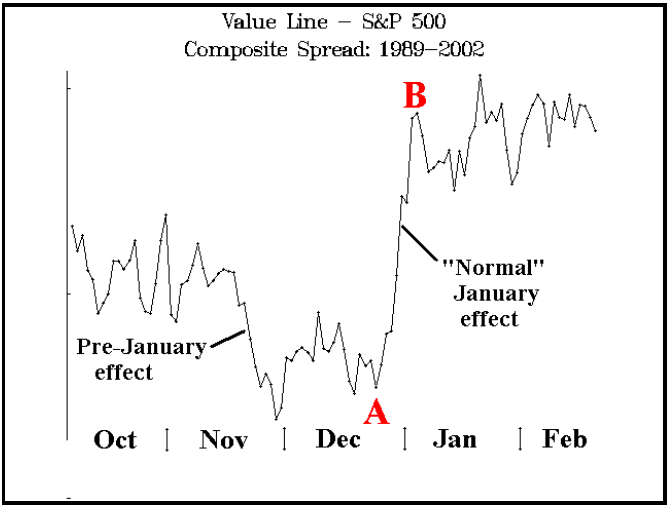
As you’ll see momentarily, the shape of this chart has changed in recent years, but it is still noticeable that there has been a “pre-January” effect, when $VLE underperforms, followed by the “normal” January effect, when $VLE outperforms. You can also see that the “normal” January effect actually starts in late December (point “A”), on average, and has pretty much run its course by the first few trading days of the new year (point “B”). Point “A” is actually 55 trading days after the end of September, which this year places it on Monday, December 23rd. Point “B” occurs 12 trading days later, which this year would be on Friday, January 10th.
The Kansas City Board of Trade (which is where the Value Line mini-futures trade), has done some research into the January effect. You can obtain a free copy of their latest research by going to http://www.kcbt.com and clicking on “subscribe.” Among other things, they have details on some trading systems built around the January effect (research source: Moore Research Center Inc., Eugene, Ore.), the most profitable of which entails establishing the January Effect spread on approximately December 27th, and exiting on approximately January 9th. I thought it was interesting that their entry and exit dates correspond so closely with ours (therefore, theirs must be good research!).
Changing Landscape
I mentioned that the spread has changed over the last few years. Specifically what has happened is, beginning the fall of 2000, there has been no Pre-January effect. In other words, small-caps have just plain out-performed the bigcaps all through the fall and on into the new year. That seems to be the pattern again this year. The chart below shows how the last three years (including this year, so far) have developed. Contrast it with the chart on the left.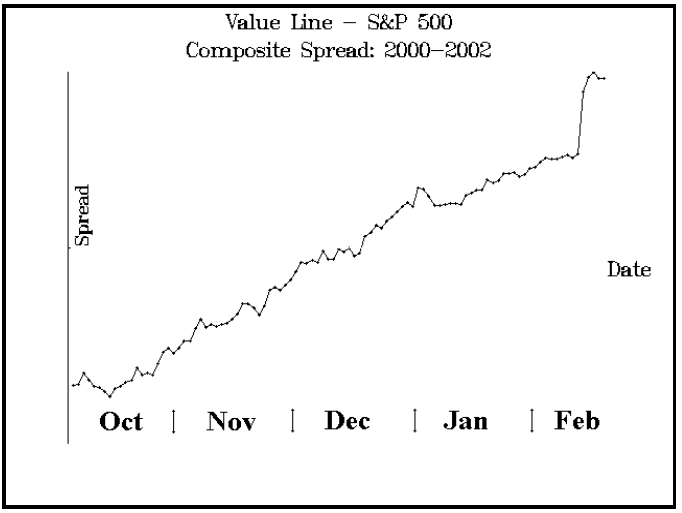
Without showing a third chart, one can visualize that if you were to “subtract” the chart on the right from the one on the left, the “Pre-January” effect would be much more pronounced. That’s the way it was prior to 2000, and that’s why we often “played” the Pre-January effect with good results. Last year, however, the Pre-January effect did not occur and we lost money with that strategy. We will therefore not be using it this year. However, the “normal” January Effect – while perhaps only a portion of the ongoing trend in the above chart – is still viable, so we will be playing that.
There is more than one way that this spread can be traded, depending on what index one wants to use to represent the small-cap market. The traditional one was to spread the Value Line futures against the S&P futures (or the mini-version of each), but Value Line futures have become rather illiquid in recent years. Another way would be to use the Russell 2000 $RUT) or Small Cap Index ($SML). Each also has iShares (Exchange-Traded funds: ETF’s) listed.
Before getting into our specific recommendation, let me give you a table that compares the equivalent quantities of each of the vehicles that might be used:
     1 Value Line mini future / 2 S&P e-mini future
  Russell 2000 ($RUT) / 5 x Russell 2000 iShares (IWM)
  Small Cap 600 ($SML) / 2 x Small Cap 600 iShares (IJR)
     S&P 500 ($SPX) / 10 x S&P 500 iShares (IVV)
           S&P 500 ($SPX) / 10 x SPDRS (SPY)
          S&P 500 ($SPX) / 2 x S&P 100 ($OEX)
         S&P 100 ($OEX) / 10 x $OEX ETF (OEF)
At the current time, the volatility of each of these instruments is about the same, so to decide how many to trade one against the other, it is only necessary to divide the two prices of the underlyings. Then, if one is using the futures instead of the iShares, the futures trading unit of $50/pt for S&P e-minis or $100/pt for Value Line minis must be taken into account.
If you want to trade the underlyings, that’s all you need to do. If you want to trade options, I would suggest buying in-the-money options with large deltas. If not, you would have to adjust for the disparity in the deltas of the options you use.
Liquidity is another consideration. The following table shows the average trading volume over the last 20 days for the various instruments (S&P-related instruments are not listed, for they are all quite liquid):
  Instrument    Average Daily Volume
ETF’s:
  IWM iShares        1,226,200
  IJR iShares          202,700
  OEF                   68,000
Options:
  $RUT                 1904 contracts
  $SML                    47
  IJR                    189
  IWM                   1480
  OEF                    770
Value Line mini futures    6 contracts
So, from a liquidity viewpoint, the Russell 2000 iShares (or its options) seem to be the vehicle of choice, spreading them against an S&P 500 or $OEX vehicle. For example, buying 116 IWM shares and shorting 100 SPY shares would work, since the ratio of the prices of those two stocks is 1.16 to 1.
If you with to use options, there really aren’t many choices for S&P 500 options – certainly not low-priced ones, as the $SPX options are quite expensive. That leaves $OEX, which is half the price, with tighter markets or the OEX Exchange-Traded Fund (ETF), symbol: OEF. OEF is 1/10th the price of $OEX and its options are usually offered in moderate size – about 100 up.
Since we only plan to be in this position for 12 days, it probably makes more sense from a strategic point of view to just use the underlying shares or futures themselves. However, if you want to lower your investment, you could utilize options. Also, of course, options give you an extra way to make money – if the underlying markets move so far as to drive one or the other option out of the money. That’s fairly unlikely in a 12-day period, but I guess it could happen. In any case, the investment is so much lower with options, we are going to impliment the spread as follows:
      Position I229: January Effect Spread
       On Monday, December 23rd, 2002,
              Buy 8 OEF Jan puts
          and Buy 5 IWM Jan calls
   where the OEF puts are three strikes in-the-money
  and the IWM calls are at least 4 points in the money
     Remove the spread on Friday, January 10th.
OEF: 46.47                 OEF Jan 50 put (OEMMT): 4.20
IWM: 78.65                IWM Jan 70 call (IWMAN): 9.30
OEF is the exchange traded fund that is 1/10th of $OEX, while IWM is the ishare that is 1/5th of the Russell 2000 ($RUT). Since OEF has striking prices that are one point apart, a put that is three strikes in the money is not really that deeply in-the-money. We want to offset that with inthe- money calls on IWM, where striking prices are five points apart. So, if the nearest strike in IWM is not at least 4 points in-the-money, then use a call that is two strikes inthe- money. So, using the above example prices, with IWM at 78.65, the Jan 75 call would only be 3.65 points in the money; hence, the Jan 70 call would be bought. We will issue instructions that are as specific as possible on the hotline update of Thursday evening, December 19th.
The 8-to-5 ratio approximates the ratio of the prices of OEF and IWM. Buying puts on OEF and calls on IWM sets up the spread as we want: expecting the small caps ($RUT) to outperform the large caps ($OEX) during the January Effect time period. The options must be paid for in full, which would necessitate an outlay of $8,010 at the above prices.
If that is more than you planned to invest, you could cut back on the size, but you would then have a “position delta.” For example, if you bought one IWM call and 2 OEF puts, that would make you “delta short” since you have “too much” OEF in your position. You could mitigate that by using options that are less deeply in the money, but then you are spending more on time value premium which could prove to be costly if implied volatility drops quickly during the 12-day holding period.
Finally, it must be understood that no one year necessarily conforms to the composite chart. Each year has its own characteristics. But the usefulness of the composite chart is that it gives us a general idea of how to trade this January Effect and, more importantly, when to trade it.
Other “January” terms
We have gone over these definitions in the past, but they have become so muddled due to television anchors mixing them up, that most people wouldn’t know one from the other without a scorecard. January Barometer: this is theory that says whatever the market does for the month of January, it will do for the entire year (“As goes January, so goes the year”). This barometer has an excellent track record. There is a similar study that says that whatever the market does in the first five trading days of the year, it will do for the entire year. Clearly, this is a less reliable indicator because of its short time frame. Santa Claus Rally: this is the theory that says there is usually a rally, beginning just before Christmas and extending just into the new year.
If you are interested in specific track records of these various theories or just more information on them, consult the Stock Trader’s Almanac, published annually by The Hirsch Organization, 800-477-3400 ext. 1, or http://www.stocktradersalmanac.com. The almanac makes a great holiday gift for your favorite trader.
This article was originally published in The Option Strategist Newsletter Volume 11, No. 23 on December 12, 2002.

© 2023 The Option Strategist | McMillan Analysis Corporation