
By Lawrence G. McMillan
This article was originally published in The Option Strategist Newsletter Volume 3, No. 4 on February 24, 1994.
One of our readers recently asked some astute questions concerning the implied volatility of long-term options versus short-term options. We thought it might make for a thought-provoking article. It is generally the case that implied volatilities of longer-term options are higher than those of short-term options (except when the underlying security has been very volatile in the near term). The relevant questions one might ask are "Why does this occur?" and "Should this occur?". We'll try to answer those questions in this article, although — as you'll see — those are not necessarily easy questions to answer in a practical sense, even though they might be in a theoretical sense.
First, let's look at an example of what we're talking about. Listed below are some implied volatilities taken from Wednesday's trading.
          Security: IBM     GM     WMX     $OEX
Expiration:
March              30.3%   29.4%  31.3%    11.1%
3-months           31.4    30.8   32.2     12.0
Near LEAPS         33.2    31.3   33.6     14.8
Far LEAPS          34.0    32.1   35.0     15.7
The figures in the above table are the implied volatilities of options expiring at the dates given: the nearest-term options (March, 1994), mid-term options (ranging from May to July of 1994, depending on the individual security), the near-term LEAPS (expiring in January of 1995, or December of 1994 for OEX), and the farther-term LEAPS (expiring in January of 1996, or December of 1995 for OEX). These actively traded options all show the same pattern: the nearer-term options trade with lower implied volatilities than do the farther-term options. Furthermore, there is a relatively uniform increase in the implied volatility as one looks farther out in time.
The main reason that this apparent volatility skew exists, with respect to time, is that it is more difficult to accurately price longer-term options. Where long-term options are concerned, one's estimate today of the fair price may eventually be proven wrong due to changes in interest rates, dividend payouts, and of course volatility of the underlying security. Dividend rates are relatively easy to predict, so they are not generally a source of worry to practitioners trying to price options. However, interest rates are another matter. As you should know, rises in short-term interest rates will increase the fair value of options — and could have a large effect on LEAPS prices (refer to our article on LEAPS that came with your initial subscription). Thus, with interest rates being so low at the current time, it is natural to expect that long-term options might be more expensive, at least partially because market makers expect interest rates to rise over the life of the option contract.
The biggest variable to predict, however, is the volatility of the underlying security. Even large, stable companies like IBM can become volatile as witnessed by the price history of that company over the past couple of years. There is no real way to predict the future volatility — especially over such a long time period — so market makers, who are the prime suppliers of options, will give themselves some "leeway" when offering long-term options. This generally means that the long-term options will be offered at a higher implied volatility than shortterm options. Then, if things later explode, at least the market maker has built in a little "edge" for himself on his initial sale of the option. Conversely, option buyers may be willing to pay a little more volatility for a long-term option since they have a long time in which to be correct.
Should options be priced in this manner? According to the Black-Scholes model, the answer is no. But according to the real world, the answer is yes. Look at the "Index Commentary" section on page 5 to see the volatility skew that exists for March OEX options. We showed back in issue 23, Vol. 2, that the probabilities that are reflected by these OEX options are not justified by the actual movement of the OEX Index itself. However, the skew exists due to real-world factors such as supply and demand, and margin requirements for selling naked put options. Just as OEX options theoretically should not exhibit the volatility skew that they do, there is no mathematical reason why there should be this "time skew" for long-term options either.
In theory, I suppose this means that one could establish reverse calendar spread (buy the near-term, sell the long-term options with the same striking price) and have a theoretical advantage. However, it is unlikely that the strategy would be successful because the skew is not going to go away. A theoretical trader who establishes a position with an "edge" only benefits if the options return to fair value so that his "edge" translates into profits. Besides, the reverse calendar spread strategy is viewed as a naked option strategy, so margin requirements are high.
Does the skew ever disappear? Of course it does — usually when the underlying stock or index becomes extremely volatile. Witness the OEX options of two weeks ago (box on right), just after the 96-point down day. The near-term volatility had risen above the mid-term volatilities. Therefore, calendar spreads were a statistically attractive strategy. As pointed out in the Follow-Up Section, things have gone back to "normal" so the theoretical edge translated into real-world profits in that case.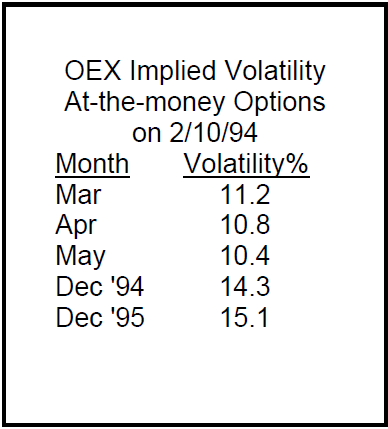
Even then, however, the LEAPS options were still more expensive than the mid-term options (again, note the bottom two lines of the above table). Thus, the "time skew" had a sort of bowl shape — higher at both ends and lowest in the middle.
The same sort of things happen in individual stocks also. For example, Telefonos de Mexico (symbol:TMX) has been very volatile lately and, as a result, so has the Mexican Bolsa (their stock market). Consequently, near-term options in TMX are the highest-priced (about 35% implied volatility) while LEAPS are the lowest-priced (under 32%).
In a case like TMX, the buyers of LEAPS options are not willing to pay an extremely high implied volatility, for they figure that TMX will not continue to be so volatile over the entire life of the option. Thus, when the underlying security becomes very volatile, the near-term options will temporarily become more expensive than LEAPS options. However, when things eventually settle down, the more "normal" relation will again establish itself.
In very volatile times, the short-term options may remain expensive for a significant period of time, making calendar spreads a good strategy. Such a case occurred after the Crash of 1987. Implied volatilities of short-term options remained high as most investors and market-makers were very wary of selling those options. At the same time, longer-term options (traded only over-the-counter in those days) were offered at lower implied volatilities. This condition persisted for several months before dissipating.
In summary, there is a real-world bias that makes LEAPS options generally more expensive than their short-term counterparts, as measured by implied volatility. However, that relationship can invert when the underlying security or index becomes very volatile. Calendar spreads are often a viable strategy in such situations.
© 2023 The Option Strategist | McMillan Analysis Corporation