
By Lawrence G. McMillan
We have continually been talking about how low the equity-only put-call ratios have been this year – first in January when they dropped to the lowest levels since levels since 2014, but then again in August when they dropped to the lowest levels in our database, which goes back to 2001.
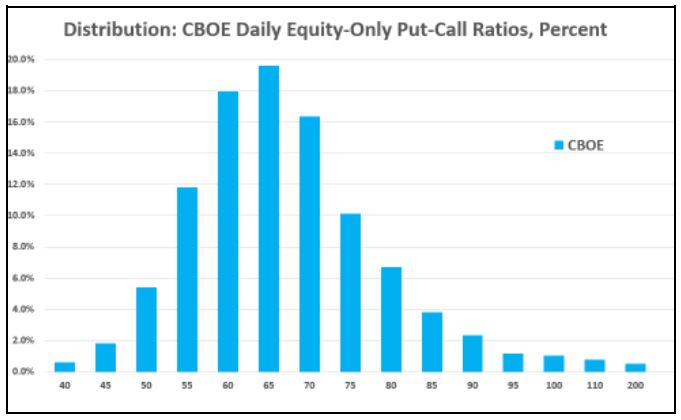
The first graph above shows the distribution of CBOE Daily Equity-only Put-call Ratio readings for the twenty years, 2001–2020 – i.e., for all the data that we have in our database. The scale along bottom (X-axis) is the daily number for the CBOE’s equityonly put-call ratio. So it begins with “40.” That is all of the days on which the ratio was 40 or less (40 puts traded for every 100 calls). There haven’t been too many of those, as you can see by the scale on the Y-axis: less than 1% of all readings over the 20 years have been 40 or less...
Read the full article, published on 11/13/2020, by subscribing to The Option Strategist Newsletter now. Existing subscribers can access the article here.

© 2023 The Option Strategist | McMillan Analysis Corporation